
Smaller family sizes and ageing populations may reduce long-run savings rates
As developing countries embark on demographic transitions, the phenomenon of declining birth rates and family size becomes an increasingly important policy dilemma. Demography has implications for a country’s labour supply, savings rates, and capital formation, all of which shape and influence its economic growth. In today’s blog, the authors argue that increases in aggregate savings from declining family sizes may be transitory, and as populations begin ageing, a declining ratio of working-aged to retired workers may reduce long-run savings rates.
Demographic transitions have occurred throughout the world since the mid-20th century. Declining fertility and mortality have combined to profoundly change the population age distribution in many countries from predominantly younger to older populations. These demographic shifts have serious long-term macroeconomic implications. Variations in the age distribution alter the ratio of savers to non-savers and change the size of households, both of which affect the aggregate saving rate, capital formation, the viability of pension schemes and labour supplies. Ultimately, these factors may affect long-run economic growth rates.
In a recent working paper [1], we find that demographics are behind most of the changes in household saving rates experienced in Japan, China, and India. We selected these countries because they experienced substantial variation in demographics and household saving rates and because of their relative size. China and India together are home to a third of humanity. By GDP (Purchasing Power Parity), Japan, China, and India are 3 of the 4 largest economies in the world.
Less children mean fewer dependents to support now, but less workers to support retirees later
We identify three potential channels through which demographics affect savings rates. The first channel is the dependent children effect. The demographic transition reduces fertility and family sizes. All else equal, a household with relatively fewer children devotes a smaller share of its income on supporting dependents and therefore can save more. Saving rates in China and India, for example, have been rising in tandem with declining family sizes.
Saving rates in China and India, for example, have been rising in tandem with declining family sizes.
The second channel works through composition effects, the proportion of households at different stages in their life-cycle. Having an older population means more of the population is retired and living off of their saved income. Thus having an older population should mechanically depress aggregate household savings rates. This is evidenced in Japan where a rapidly ageing population has reduced savings rates. On the other hand, savings can only be generated from unspent earnings, only generated by a working age population. Having a larger share of young or working-aged people will therefore mechanically raise the aggregate saving rate.
The third channel operates through intergenerational family transfers. Declining family sizes mean that the ratio of workers per retiree decreases. The current working age population therefore has to save more aggressively because they will be supported in retirement by a smaller number of working-aged people. Workers in China and India, particularly, will have fewer children supporting them in retirement than previous generations.
Household saving rates vary substantially across countries.
As depicted in Figure 1, Japan's saving rate increased from 12 percent (already quite high) in 1955 to a peak of over 23 percent in the mid-1970s and then fell to less than 5 percent by 2012. In contrast, Chinese households currently save nearly 30 percent of their income, but saved relatively little prior to the 1980s. India's saving rate also has risen steadily over time. Indian households saved less than 10 percent of their income before 1970, but have saved nearly 25 percent in recent years.
Figure 1: Household rates in Japan, China, and India
While each country experienced large swings in their household saving rate, the direction of changes has differed. Our hypothesis is that these divergent saving patterns are explained, at least in part, by differential demographic patterns across the countries.
Each of these countries embarked on the demographic transition, moving from a relatively young to an aging population. However, these transitions have occurred at different times and on different scales. Figure 2 graphs changes in the distribution of age groups in each country as a share of the total population from 1950 through 2050 (projected).
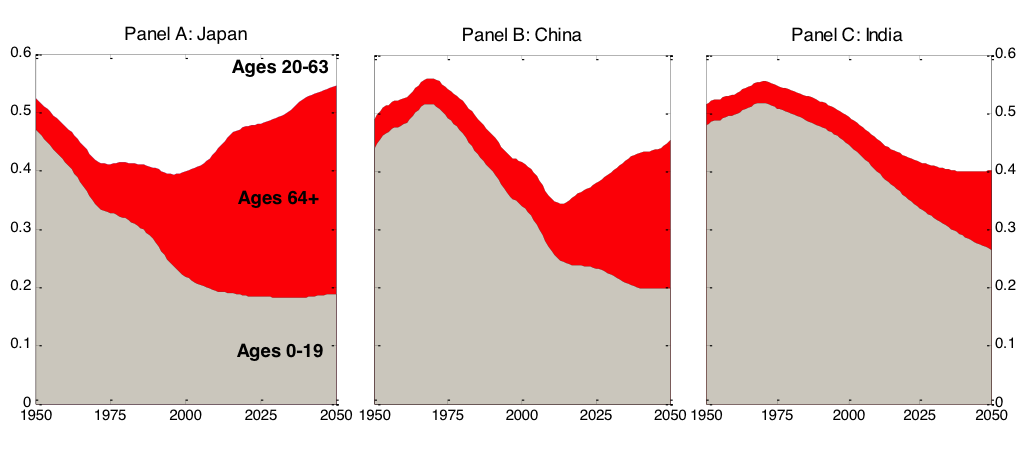
Figure 2: Population shares by broad age groups in Japan, China, and India
Notes: The lowest area, shaded brown corresponds to the share of the population below the age of 20 (a proxy for dependent children), the red segment is the share of the population over the age of 64 (retired), and the remaining population share is the working-age population. All three groups sum to 1 but the figure is truncated above at 0.6. The data is from the United Nations Population Prospects 2012.
Looking across the three panels, Japan (Panel A) has the oldest population; while their share of youth has stabilised near 20 percent, the share of their population that is retired is at 25 percent and still growing. Japan is now considered the oldest country in the world.
China (Panel B) experienced the most dramatic decline in its share of youth. Fifty percent of the Chinese population was under 20 in the 1970s, compared to less than 25 percent today. China remains much younger than Japan, but is expected to experience dramatic ageing.
India's demographics (Panel C) follow a pattern similar to Japan and China, but the onset of their demographic change was later and more gradual. The share of their population under 20 has been declining since 1970. However, compared to Japan and China, India has, and is expected to maintain, a higher share of youth and a smaller share of retirement-age workers (over 63).
Japan is now considered the oldest country in the world.
Declining birth rates have been a key determinant behind these demographic shifts. Following a temporary increase after WWII, Japanese fertility rates have been steadily falling since the early 1960s. Fertility rates are so low that, after peaking at 127 million in 2009, the total population began to decline and is projected to fall to 107 million by 2050.
In China, fertility rates have been declining since the 1970s. In response to growing population pressures, a voluntary government run campaign, known as `Later, Longer and Fewer,' was launched to encourage couples to delay marriage, increase the spacing between children, and limit the number of children to two. Although Later, Longer and Fewer was successful, the Communist Party intensified efforts to reduce fertility by formally adopting the One-Child policy in 1980.
Increases in household savings from demographic transitions are likely temporary, ageing populations may reverse trends
In China and India, the current, relatively large, working age populations are saving in anticipation of their retirement. These large cohorts in China and India also have (relatively) fewer dependent children to support, as fertility rates have declined. Thus, households in China and India have more resources available to save than they would with larger families. And, looking forward, Chinese and Indian households will have fewer working age children to support them upon retiring, so these households are accumulating assets now. Meanwhile, the preponderance of older people in Japan reduces its aggregate saving rate because retirees live off of their accumulated assets rather than accumulating new savings.
Workers in China and India, particularly, will have fewer children supporting them in retirement than previous generations.
The implications of demographics on saving rates are important for several reasons. Our study suggests that the demographic contributions to saving rates may be transitory. The rise and predicted fall in China's working-aged share of the population mirrors that of Japan's historical experience. Thus, China's future trends in household saving rates might resemble those of present day Japan. Population aging has greatly reduced saving in Japan and will do the same in China. To the extent household saving contributes to national saving, these patterns may be an indication of the future external imbalances across the world [2]. The on-going changes in household saving rates also partially determine future investment-based economic growth. As Japan's national saving rate declined, its growth slowed. The same outcome could occur in China. Meanwhile, in the near term, India has a more favorable demographic outlook. Finally, all three countries (and much of the world) must deal with a growing elderly population, and accumulated household savings will, of course, be central to this issue.
Further reading:
- Curtis, C., S. Lugauer, and N.C. Mark (2015): “Demographics and Aggregate Household Saving in Japan, China, and India,” National Bureau of Economic Research (NBER) Working Paper No. 21555.
- Backus, D., T. Cooley, and E. Henriksen (2014): “Demography and Low-Frequency Capital Flows,” Journal of International Economics, 92. pp. 94-102.