
Has Uganda recovered from the COVID-19 lockdowns?
The economic effects of the pandemic were rapid and difficult for policymakers to respond to. Moreover, conventional economic indicators require longer time periods for efficacy. In our study, we utilised electricity consumption as an indicator for economic activity during and after the pandemic in Uganda, and find a decline in electricity consumption during lockdown.
As the COVID-19 pandemic took its toll on countries across the globe, governments took unprecedented measures to contain the speed of transmission, build much needed testing and treatment capacity, and keep economies afloat.
One critical challenge through it all was the lack of timely economic indicators to better understand both the effects of the COVID-19 pandemic (and resultant global recession), and of the government policies implemented in response to it.
The problem for many developing countries is that the available indicators of economic activity often come with a significant lag of at least a month, and therefore cannot keep pace with abrupt economic changes. This creates a costly window of uncertainty in which households may be exposed to the full economic costs of the downturn, during which policymakers are unable to effectively measure these costs and respond accordingly.
Using electricity data to interpret economic shocks
In this context, electricity data can offer some potential as a low cost and readily available indicator of economic activity. Several studies (Cicala 2020, Figer 2020, Blonz and Williams 2020) have shown that sharp economic shifts often show up in a large and rapid change in electricity usage. Given its usage across all sectors in the economy and across different geographic areas, electricity data in a disaggregated form can provide critical information on the differential effects of shocks to the economy.
To illustrate this potential, we used transaction-level data on electricity consumption to explore how electricity use by firms and households varied before and after the onset of the global COVID-19 pandemic and the lockdown imposed in Uganda between March and May 2020. In particular, we made use of data on domestic and commercial electricity usage from Uganda’s dominant electricity distribution company, UMEME Ltd., spanning a two year period from November 2018 to November 2020. UMEME is the largest electricity distributing company in Uganda, covering 95% of total power connections.
Sharp decline in electricity consumption during lockdown
The data reveals a large and steep decline in average electricity consumption through the lockdown, with a slow and not complete recovery since then. Average consumption declined by 12.3% or 6.1 KWh between March and April 2020, as shown in Figure 1.
Figure 1: Average electricity use across all commercial and domestic customers
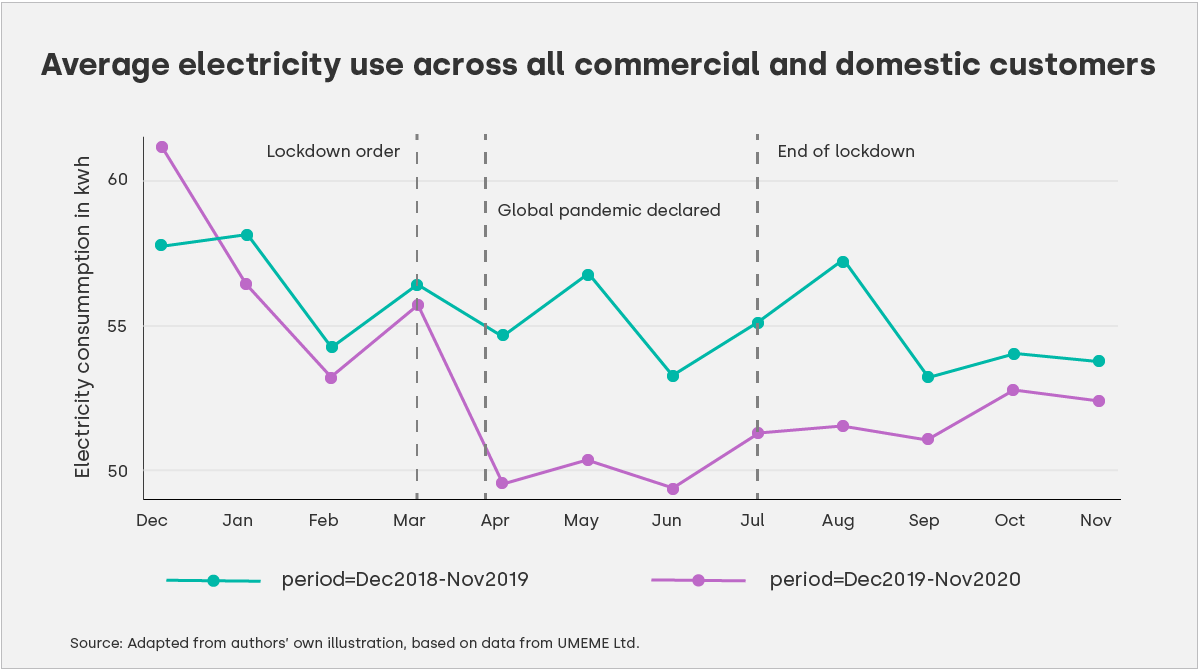 (Source: authors’ own illustration, based on data from UMEME Ltd.)
This was seen across urban and rural areas, as well as across both commercial and domestic users. As a result of businesses being forced to suspend operations, commercial electricity usage was particularly badly affected and went down.
Effects on electricity usage were heterogenous across districts
Considering geographic differences, we find that while the drop in electricity usage was widespread across the country, there was heterogeneity across different districts and regions. Northern Uganda experienced the largest change in electricity consumption between November 2018-19 and November 2019-20.
There were also significant differences between districts, as shown in Figure 2. For example, while average electricity consumption during lockdown months fell by 18% compared to the previous year in Kapchorwa district (Eastern Uganda) it actually increased by 3% in Jinja district (also Eastern Uganda). Such differences could be attributed to the industrial structure of particular districts and how or to what extent the pandemic and resultant government restrictions limited economic activity. For example, Kapchorwa district is located at the border with Kenya and is heavily dependent on cross-border trade, mining of limestone, and tourism (being home to Sipi falls and Mt Elgon National Park) – all activities which have been severely impacted by the closure of international borders and shelter-in-place orders.
Figure 2: Average annual change in electricity use by district
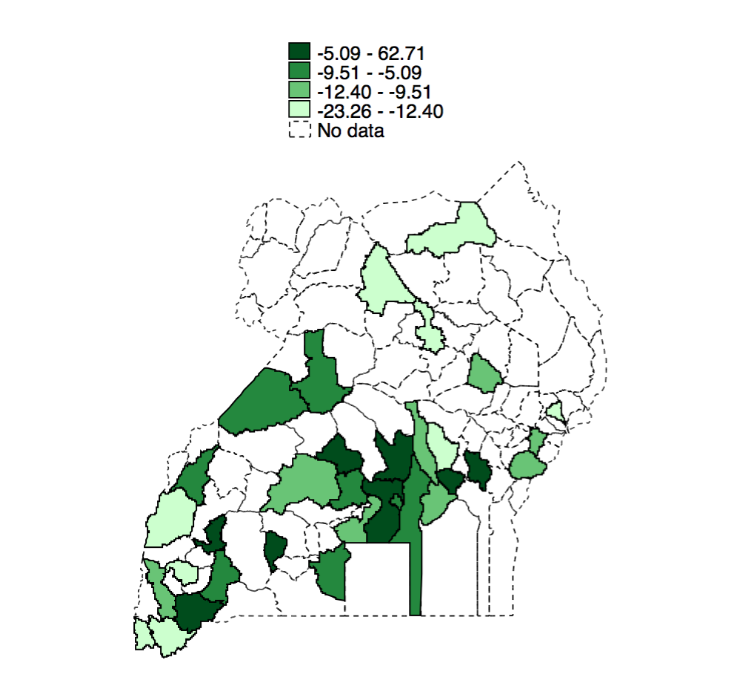 (Source: authors’ own illustration, based on data from UMEME Ltd/UBOS)
Note: districts with no data do not have UMEME connections
Zero vending customers decreased during the lockdown
The figures above suggest a sharp and persistent decline in economic activity in the wake of the COVID-19 pandemic. However, in considering inclusive recovery, it is valuable to examine specific trends in ‘zero vending customers’ i.e., those customers purchasing zero electricity in a given month.
In Figure 3 below, we see that in the first month of the lockdown, there was a decline in zero vending customers, the majority of whom are domestic-tariff consumers. In other words, we saw more households who are connected to the grid but would normally not purchase electricity, consuming electricity in March and April. One possible explanation for this is that with the majority of the population forced to stay at home or work-from-home, even those who would normally not purchase any electricity had to buy the bare minimum amount of electricity to ‘keep the lights on’.
Figure 3: Zero consumption count in Uganda
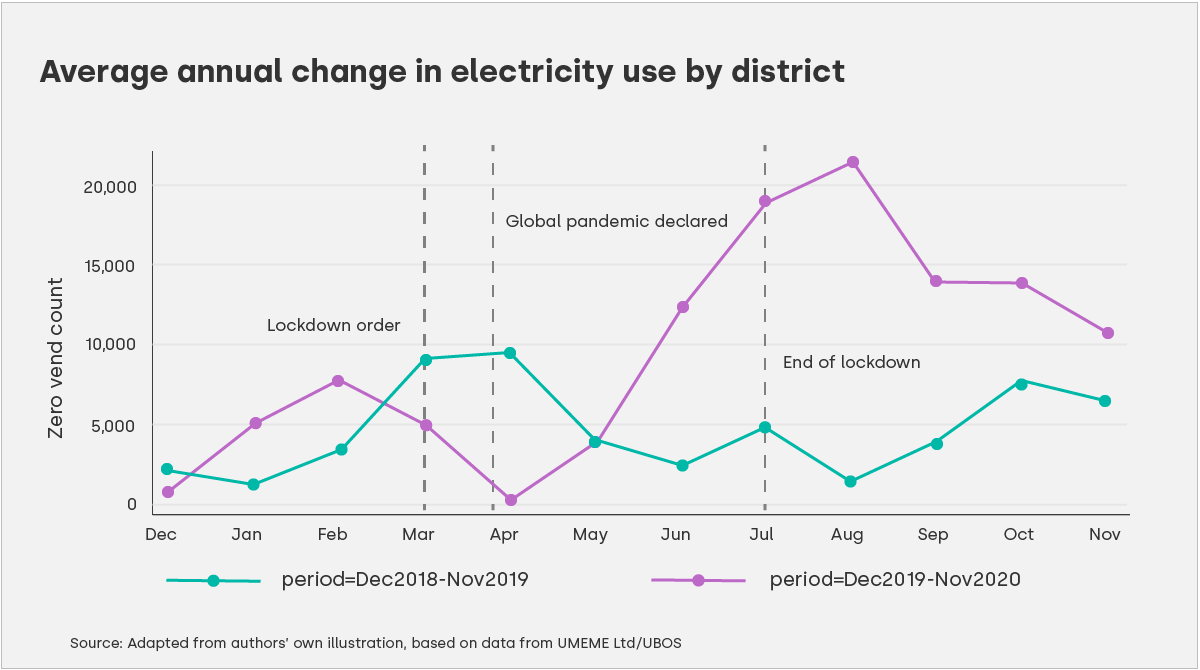 (Source: authors’ own illustration, based on data from UMEME Ltd/UBOS)
Since April, we saw a sharp increase in zero consumption customers, likely due to the introduction of free connections by the government which many new customers took advantage of, even if they weren’t going to use electricity.
Policy implications
Given the availability of real time electricity data in developing countries such as Uganda, leveraging this kind of big data can be invaluable for governments in tracking economic activity and future shocks. There may be significant value in working closely with service providers to develop real-time dashboards of such data, which could go on to include other commodities which reflect economic activity accurately based on the region of study.