
India's commodity tax system leads to low compliance
Data on tax rates in India for the past fifteen years reveals how rates vary by state and product. This heterogeneity and volatility results in high compliance costs, inter-state distortions, and households substituting toward lower-tax products.
Tax in India
India’s commodity tax system is complex, with large variation across states, products and time. We document the complexity in the tax code and the variation in tax rates by studying historical archives of the tax code for each state. Tax code complexity varies substantially by state, with some states having more than 20 different tax rates. The variation across commodities is generally very large, with taxes anywhere between zero and 115 percent. Tax rates also change frequently over time.
We will use the data discussed here to study the effect of recent Indian tax reforms. As in many developing countries, in India, taxes on goods make up an important part of tax revenue. About 61 percent of Indian states’ own-tax revenue comes from commodity taxes. India has seen two important tax reforms in recent years:
- one in the mid-2000s that moved India from a sales tax to a state-specific value-added tax system,
- and a second one in 2017 that simplified and centralised the system.
India’s tax system has always been complex compared to that of other countries because tax rates have traditionally varied both at the state level and by the specific product. This means that firms need to keep track of many different tax rates, which results in high compliance costs with the tax system, for example, due to complex accounting. Tax complexity may also lead to tax evasion and distortions in production.
Data collection
One of the challenges with India’s tax system is that there is no database of all state- and product-specific tax rates over time. As part of our research, we assemble the first database that creates a harmonised listing of tax rates by products across the states dating back to 2001. To do this, we first obtain the tax rate schedules for the last fifteen years for every state in India. Figure 1 provides an example of one page of a schedule for the state of West Bengal.
Figure 1
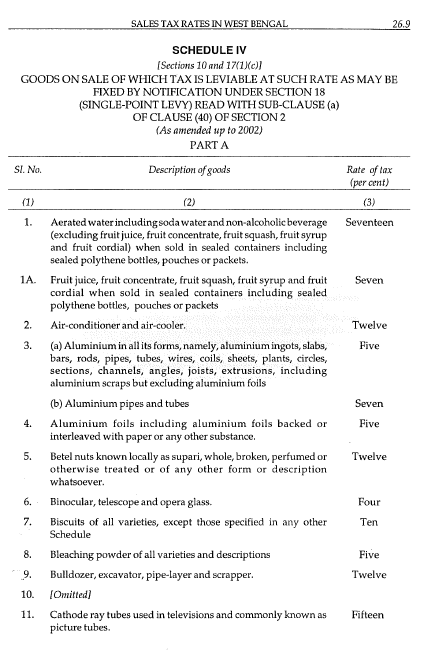
Source: Commercial's All India sales tax tariff : states' sales tax rates (2002)
We began by digitising all these schedules for every state. We then read Indian archives of tax change notifications, such as this one, to determine changes in the tax rates over time resulting from any amendments or rule changes. Given that commodity names may be written differently in different states, we use name matching algorithms to obtain a harmonised database of tax rates for all products in all states for the last fifteen years.
Complexity of the commodity tax system
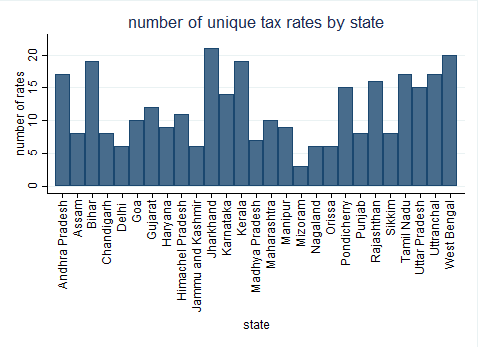
Figure 2 uses this newly created database to show the number of unique tax rates on different commodities for each state under India’s sales tax system in 2001. States have anywhere between three to twenty-one different tax rates, with Jharkhand being the most complex by this metric.
Figure 2
Variation in tax rates across products
Of course, the number of tax rates applicable in a given state is not a perfect measure of how costly it is for firms to comply with the tax code. Compliance costs are likely to be higher in states with a higher number of tax rates. Other characteristics, such as the average tax rate in a state or the range of tax rates across commodities, play an important role as well.
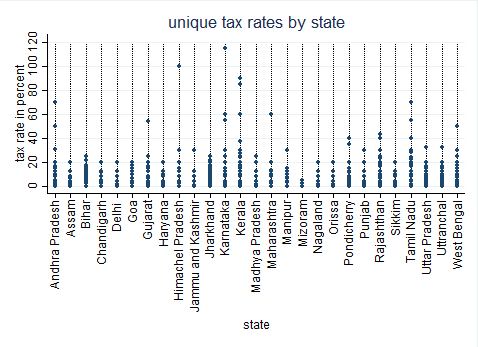
In Figure 3, each dot represents a different tax rate on a commodity or a set of commodities in 2001. As can be seen in the graph, Karnataka has tax rates ranging from zero to 115 percent, while in Mizoram, the rates only range from zero to five percent (this very high tax rate is on certain types of liquor!). The median tax rate in a given state ranges from two percent in Mizoram, to 18 percent in Tamil Nadu.
Figure 3
Tax changes over time
How have tax rates changed over time? Given that states can set commodity-specific tax rates, this depends on the commodity. Here, we focus on one important commodity: diesel. We show the tax rates from 2005 to the present. Over this time period, many states were switching from the historical sales tax system to newly-passed value added tax systems. Some of these tax changes incorporate that shift, while others are simply legislative changes.
To summarise how tax rates were changing over time, Figure 4 shows the average tax on diesel across all states. To construct the national diesel tax average, we weight each state by its population – holding the population fixed – so that bigger states are more important when constructing the average in each year. Over the last decade, tax rates on diesel have been falling although they have recently begun increasing toward 18.5 percent.
Figure 4

The prior figure masks the heterogeneity in volatility of tax changes across the states. Figure 5 shows the tax changes for the five largest states in India. While the trend is generally downward, some states did pass tax increases over this time period. In general, the smallest states, not depicted on this graph, had fewer tax changes than the largest states. Some states never changed their tax rates over this time period.
Figure 5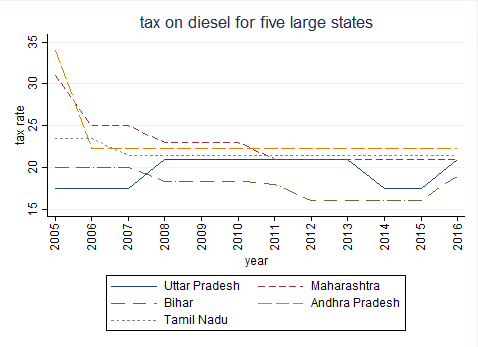
Conclusion
These four graphs show substantial tax complexity within states, across states, and over time. These all contribute to the compliance costs of India’s tax system. The sheer number of tax rates within states may create substantial distortions, as households substitute toward lower-tax products. Under the value added taxes, cross-state differences may create opportunities for fraud relating to inter-state commodities.
Studying taxation in a developing country is especially interesting because most previous research has focused on taxation in high-income countries, where institutions and tax enforcement mechanisms are well developed. In a country such as India, weaker institutions may potentially result in different responses. The data we have collected will allow us to study how simplifications to the tax code through India’s recent commodity tax reforms influence firm productivity and tax compliance.