
Tanzania is not on track to meet its Millennium Development Goals target despite a growth record that – as reported – is impressive. Real GDP growth reached historically high levels between 2000-2006, yet this is set against only the slightest reduction in the poverty rate – from 35.7% in 2001 down to 33.4% in 2007.
Indeed, ‘few adult Tanzanians think they are enjoying the fruits of economic growth’ and ‘in all income groups … more people perceive falling rather than rising living standards’ according to the findings of the Views of the People Survey in March/April 2007 (Poverty and Human Development Report 2007).
Interrogating the data is essential to understanding why impressive economic growth has not lead to a corresponding reduction in poverty. This is not only important to assess progress, but also when considering how social objectives are translated into concrete measures and indicators.
The first point to make is the importance of working with per capita figures. While the poverty figures depend on consumption per person, the GDP statistics refer to the national total. Between 2001 and 2007 the population of mainland Tanzania grew by 16.5% (National Bureau of Statistics 2008). The increase in GDP per person was 29.9% – an impressive macroeconomic performance that should have substantially reduced poverty. So we need to dig a little deeper to see what is going on.
Our research shows that one of the reasons why rapid growth has not had a larger impact on poverty is that the rise in household consumption has not been equally shared (Atkinson and Lugo 2010). However, this may not be obvious if you use a relative measure of inequality, as some have done. According to this measure, if all consumption levels rise by the same proportion one can conclude, as the 2007 Household Budget survey did, that ‘inequality in the population as a whole has remained unchanged since 2000/1’ (National Bureau of Statistics 2009).
However we argue that if we are concerned with the impact of distribution on poverty reduction, then it is more appropriate to use an absolute inequality measure. This means that a situation where inequality is stable would be one where all consumption levels rise by the same absolute amount and where the cost of inequality is measured in absolute not proportionate terms.
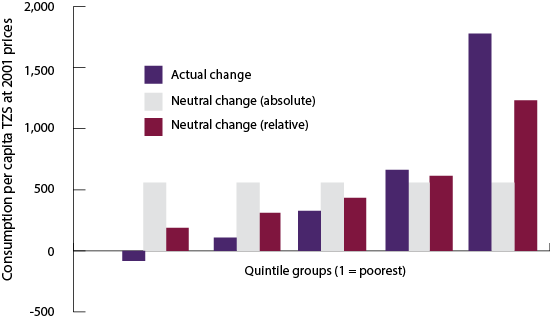
Taking an absolute approach highlights that inequality in Tanzania has grown substantially and that greater poverty reduction could have been achieved if the absolute increases in real income had been more evenly spread. For example Figure 1 shows that the bottom two poorest groups – largely consisting of those below the poverty line – had, on average, virtually no growth in per capita consumption. In contrast, the gain for the richest fifth of society is three times the amount that would have been generated by an equal absolute increase in all consumption levels.
Figure 1. Absolute increases in per capita consumption by quintile groups
There are also limitations in the definition of total consumption. There is, for example, a large difference between the average rise in per capita consumption shown by the household surveys and the rise in per capita household consumption recorded in the national accounts between 2001 and 2007.
We can explain some of this by looking at the constant price national accounts for Tanzania mainland in 1998-2007. These show that household consumption fell from 62% to 54%, while government final consumption and gross fixed capital formation rose by 3% and 4%, respectively. As a result, the rise in household consumption expenditure per capita was 26%, 4 percentage points less than the rise in GDP per capita.
The fall in household consumption is even larger in the current price national accounts, where it fell from 62% to 48% between 2001 and 2007 (National Bureau of Statistics 2008). This highlights a key issue – the change in relative prices. The price deflator for household consumption rose by 42% between 2001 and 2007, compared with much larger increases for other categories of expenditure – 62% for government final consumption, 85% for gross capital formation and 83% for exports. This means that the increase in the deflator for household consumption was 10 percentage points less than that for GDP as a whole.
Given these types of discrepancy, we argue that there is a case for downplaying a single measure of consumption poverty and for considering instead a portfolio of deprivation indicators that reflect specific types of consumption, notably nutritional indicators, housing and durables, and those that reflect spending on health care and education. Such a portfolio would, in turn, highlight the key roles played, on the one hand, by agricultural production and, on the other hand, by public provision of health care and education, where issues of quality and distribution are important. The portfolio could be the basis for the analysis of multiple deprivation at the individual household level, capturing the degree of overlap of disadvantage.
We undertook an analysis to show how this could be done in a manageable way and the extent of progress in Tanzania in the three areas considered. The results shows that between 2001 and 2007, school attendance and ability of durable assets have improved significantly, whereas access to protected sources of drinking water has deteriorated. Despite the latter, the combined effect reduced the proportion of Tanzanians who suffer from any of the three forms of deprivation from 90% to 80%. Equally, there has been a fall in the proportion deprived on all three dimensions from 19% to 10%.
While our analysis is purely illustrative, it indicates how multiple deprivation at the household level can be incorporated in a manageable way into the assessment of economic and social performance. We hope our research may contribute to the establishment of goals for the next stage of the Millennium Development Goals and Tanzania’s national development strategy (MKUKUTA).
Further reading
National Bureau of Statistics (2008), National accounts of Tanzania Mainland, 1998-2007, Dar es Salaam.
National Bureau of Statistics (2009), Household Budget Survey 2007, Dar es Salam.
Atkinson AB and Lugo MA (2010), “Growth, poverty and distribution in Tanzania”, IGC Working Paper No. 10/0831.