
Pass-through shocks and income: The impact of COVID-19 on remittances in Ethiopia
Following COVID-19 induced global restrictions on the movement of people and activities, the Ethiopian economy, particularly the external sector, has faced significant challenges. COVID-19 related global disruptions have considerably affected tourism, exports, imports, and remittances to the country.
The Population Division of the UN Department of Economic and Social Affairs estimates that there are 1.3 million Ethiopian migrants across the globe. Annually, Ethiopia receives USD 5-6 billion largely from its diaspora in the US, Europe, and the Middle East. Private individual transfers, including remittances, are the single most important category of foreign exchange for Ethiopia (Figure 1), covering 35% of imports. This is almost three times that of the country’s goods exports.
Figure 1: Private individual transfers cover more than a third of imports
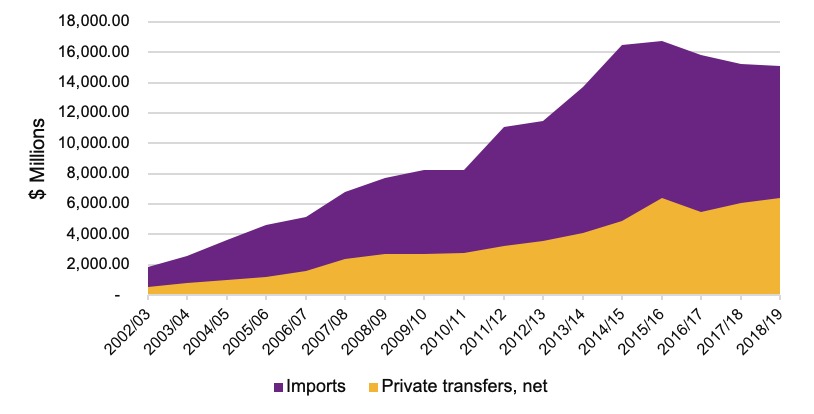
Source: National Bank of Ethiopia
Remittances reduce poverty, but they have been declining since the start of the pandemic
Beyond the macroeconomic benefits of remittances, studies show that they have a significant poverty reduction effect (Beyene 2014, Andersson 2012), especially for female-headed households (Assaminew et al. 2010). In addition, remittances are mostly used for consumption expenditure rather than investment, especially at lower levels of income (Beyene 2014).
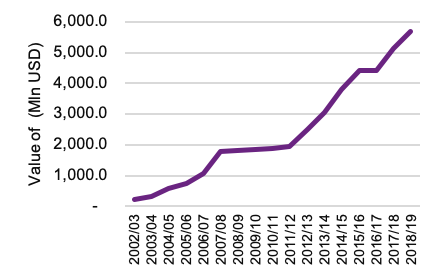
As shown in Figure 2a, remittances have considerably surged over the last two decades, increasing from USD 233 million in 2002/03 to USD 5.6 billion at the end of 2018/19. The trend in private transfers, including remittances, in the past few months, however, is declining (Figure 2b). Remittances in February have declined by 5% from January and fell by a further 18% in March compared to February. Compared to the same period last year, the private transfers in March have declined by 17%, indicating that the fall is not explained by seasonal.
Figure 2: Trends in private transfers (both official and unofficial)
A
B
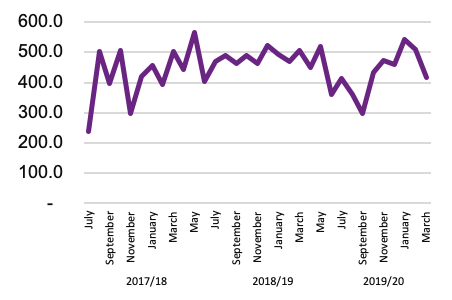
Source: National Bank of Ethiopia
Forecasting the impact on the economy
In order for policymakers to plan ahead to mitigate the impact of the pandemic, it is important to forecast the anticipated impact on the economy. Accordingly, we employ a Social Accounting Matrix (SAM) based Multiplier model, which is suitable to analyse the overall effect of a given shock (in our case, COVID-19 induced reduced remittances) on a number of outcome variables including GDP.[1]
Using the latest SAM for Ethiopia[2], we employ the SAM based Multiplier model analysis as used in Arndt et. al (2013) and Cardenete and Sancho (2012). The SAM we use (hereafter PSI-EU SAM) is at agro-ecological level and consists of 227 accounts including 61 activities, 71 commodities, six factors of production, three types of taxes (direct, indirect, and import), six households, and one account each of trade margins, saving-investment, enterprises, government, and rest of the world.
Accordingly, we simulate the multiplier effects of the pandemic on the economy as a shock passing through reduced remittances.[3] In doing so, we use two different timespan scenarios for which the pandemic is assumed to last: three months based on actual remittances/private transfers data, and six months based on projections[4].
As Ethiopia does not produce quarterly accounts, we assume that the three months and six months period constitute 25% and 50% of the annual value respectively. Then, we make an estimate of the magnitude of the shock for the two periods. For the three months scenario, we assume remittances decline by 40% between February and April 2020, in line with actual data during the period. For the six months, we assume that the reduction in remittances to be about 30%. This is in line with the anticipation that the reduction in remittances will ease amid the relatively improving conditions in remittance source countries, although the recovery might be slower.[5]
Household consumption significantly affected
Figure 3 shows how a COVID-19 induced shock on remittances impacts GDP and overall household consumption for the three and six-month scenarios.
Figure 3: Negative shock on remittances considerably reduces households’ purchasing power

Source: Based on PSI-EU SAM
Figure 4 below displays the combined direct and indirect effect of reduced remittances on household income for different household groups. The set of bar graphs show the estimates under three and six-month scenarios, both suggesting a larger negative income effect on the urban poor.
Figure 4: Middle-class receives most remittances but consolidated impact hits urban poor hardest
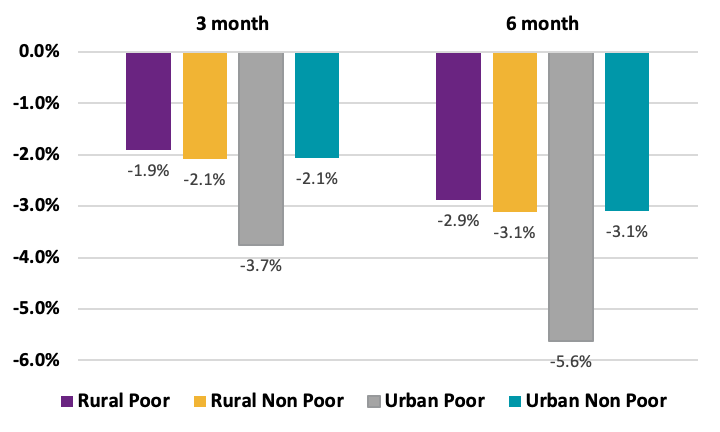
Urban poor receive the least remittances, and yet will be the most affected
The impact is a combination of a direct impact on households and an indirect impact of the shock on the overall economy. There is considerable variation in the proportion of remittance received across households. According to the 2017 SAM, the overall remittance flow distribution is received as follows:
- Rural middle-class - 38%
- Urban middle-class - 28%
- Urban rich - 18%.
- Rural rich-7%,
- Rural poor - 5%,
- Urban poor - 4%
However, even though the poor, particularly the urban poor, receive a disproportionately lower proportion, they bear the biggest indirect effect.
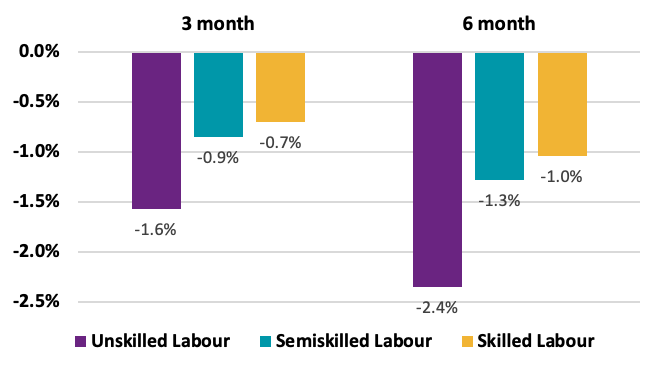
This is likely from the reduction in remittances slowing demand and leading to more labour underemployment, especially at lower skill levels. Under each of the three and six-month scenarios, the impact of the shock results in varying impact across skill levels. The relatively larger unemployment rate for the unskilled could be related to:
a) Less “insurance” against a job loss meaning they would be first in line to be laid-off during a low production period.
b) Employment in labour-intensive and unsophisticated sectors with less scope to retain workers during a shock.
Figure 5: Unskilled labour impacted the hardest
Source: Based on PSI-EU SAM
The policy response to the remittances shock depends in part on whether this shock is transitory or longer-lasting. The bulk of remittances and private transfers are from households in permanent residence in other countries, where the economic rebound is likely to facilitate a faster rebound in remittance flows back to Ethiopia.
However, there is a subset of remittances coming from lower-skilled migrant workers employed in source countries, particularly as housemaids in the Middle East. For this subset, the reduction in remittances is likely to get worse and last longer as more than 10,000 workers in these and other African countries have recently been deported back to Ethiopia, most of them empty-handed, amid fear and suspicion of foreigners as potential COVID-19 transmitters (International Organisation for Migration 2020). Anecdotal evidence suggests that the poor may be the major beneficiaries of these remittances, and the expectation of a longer shock would make the impact on poverty even more severe.
As indicated above, remittances are by far the most important foreign exchange sources and considerable drops will hamper the economy. If we assume a 20% fall, in line with World Bank global estimates for low- and middle-income countries, that would be over USD 800 million in 2020 alone. Moreover, channels of transfer of remittance money may face disruptions in the recipient countries, where financial technology is not developed and physical interaction is required to receive money. With containment strategies limiting physical interactions, it will likely increase the cost of receiving remittances.
Policy recommendations
A number of policy options are available to mitigate the effects of the pandemic on recipient countries, including:
- Expand and promote digital money transfers by reducing fees. The use of mobile money is steadily increasing in Ethiopia, with the potential to provide access to financial services to the more than 80% of the population that live in the rural areas. To mitigate the effects of a disruption in remittance transfers, expanding and promoting digital money transfers by reducing fees, can help the smooth transfer of funds. Already, the National Bank of Ethiopia raised the mobile money transfer limits, making it easier to receive remittances. Further integrating international remittances with mobile money would ease access to remittance funds for the urban poor, with the added advantage of maintaining physical distancing.
- Do not tighten enforcement on the parallel exchange market. Currently, the National Bank of Ethiopia estimates that about half of private individual transfers use official channels. The other half use the parallel market for foreign exchange. The National Bank of Ethiopia is undertaking reforms to unify the two rates through improving the working of the foreign exchange market and thereby re-directing remittance flows to the official channels. At this juncture, it would not be timely to attempt to tighten enforcement on the parallel market, which would slow the flow of remittances.
While these measures are important, the appropriate macroeconomic stance is one that recognises the largely transitory nature of the remittances shock for Ethiopia.
Disclaimer: The views expressed in this post are those of the authors based on their experience and on prior research and do not necessarily reflect the views of the IGC.
Footnotes:
[1] For details on the model please refer to Arndt et. al (2013).
[2] The SAM was developed by the Ethiopian Policy Studies Institute (PSI) and EU, utilising different micro and macro datasets from the 2016 period. SAM is a powerful tool that analyses the structure of an economy and interdependence between different sectors. It depicts detailed resource flows between different activities (e.g. agricultural), factors of production (e.g. labour), and institutions (e.g. households) over a financial year (Breisinger et al. 2009).
[3] As is standard for SAM based multiplier analysis, the simulation is introduced as a demand-based shock, excluding any response function.
[4] It has already been about three months since the first known COVID-19 case in Ethiopia and given the increasing cases in the country, it is likely that pandemic will last more than three months. We therefore simulate three month and six month periods.
[5] For the latter three months, we assume a 20% decline compared with the previous year and an increase of 25% from the previous Feb-April quarter.