
What happens when you give $50,000 to an aspiring Nigerian entrepreneur?
Most firms in developing countries have no paid workers, and hardly any reach the size of 10 workers or more. For example, Hsieh and Olken (2014, p.93) report that in India and Indonesia “the fraction of firms with less than 10 workers is almost visually indistinguishable from 100 percent”, and in Nigeria, survey data indicate that 99.6 percent of firms have fewer than 10 workers. Are there constrained entrepreneurs in developing countries with the ability to grow a firm beyond this 10-worker threshold? If so, this raises the questions of whether such individuals can be identified in advance, and of whether public policy can help them overcome these constraints to firm growth?
I address these questions in a new working paper that evaluates a nationwide business plan competition called YouWiN! in Nigeria.
The Business Plan Competition
The YouWiN! competition was launched in late 2011 by the President of Nigeria, and in its first year attracted almost 24,000 applications aiming to start a new business or expand an existing one. The top 6,000 applications were selected for a 4-day business plan training course, and then 1,200 winners were chosen to receive awards averaging US$50,000 each. 729 of the 1,200 winners were randomly selected from a group of 1,841 semi-finalists, providing experimental variation from US$36 million in grants that enables causal estimation of the program’s impact. Three annual follow-up surveys enable tracking the trajectory of impacts.
What do these awards do?
If applicants are not credit-constrained, then receiving a cash grant should not change the optimal investment decisions of their businesses, and we should not expect to see any change in business outcomes as a result of the grant (the paper discusses this more formally). But in fact the grants result in large impacts in business performance:
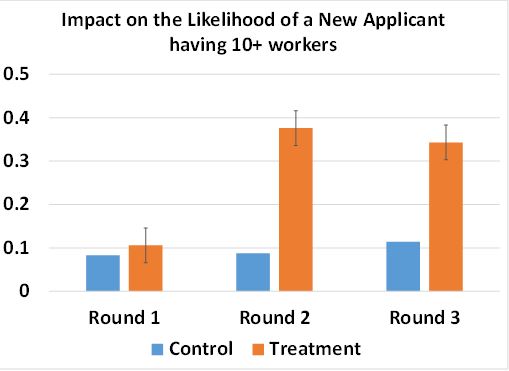
- For new firms (aspiring entrepreneurs), winning results in a 37 percentage point increase in the likelihood that the individual is operating a firm three years later; a 23 percentage point increase in the likelihood the firm has 10 or more workers (Figure 1); more innovation; and a 23 percent increase in profits.
Figure 1: More New Firms Reach the 10 Worker Threshold
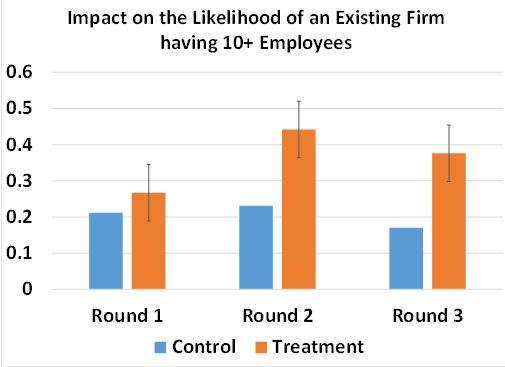
- For existing firms, winning results in a 20 percentage point increase in survival over three years; a 21 percentage point increase in the likelihood the firm has 10 or more workers (Figure 2); more innovation; and a 25 percent increase in profits.
Figure 2: More Existing Firms Reach the 10 worker threshold
Broader points of interest from an Impact Evaluation/Measurement Perspective
Those are the headline results. I thought I’d note a few points that may be of broader interest to our readers – for readers more interested in the policy implications or more details on the results, see the paper or a 2-page impact note.
- Reducing attrition: With this type of competition, the sample is very geographically dispersed, coming from across the whole country. More successful and busier firms can also be harder to interview than 1-person subsistence enterprises who have more periods with slow business. In a previous post I blogged about how persistence really paid off in getting response rates to be high – whereas if we had stopped at three callbacks we would have had a much lower response rate.
- Administrative data not a gold standard: we often are suspicious of survey data and wish that we had some administrative data (which can also suffer less from attrition and be much cheaper to obtain). The program collected data on employment from the winners at around the same time as our second year survey. Appendix 6 in the paper compares the two measures, and finds 75 percent of firms report more workers to the program than they do in our survey (and only 14% report more in the survey). The grants were paid out in tranches, with the final tranche conditional on showing progress on hiring. Even though the thresholds were low to achieve this, comparison with physical worker counts suggests the administrative data is an overcount of workers. In contrast, the survey data seem reasonably accurate.
- There doesn’t seem to be great evidence on how much it costs to create a job: I calculate the cost per job created at around $8,500, or $3606 per job-year over the first three years. By way of comparison, fiscal stimulus in the U.S. costs around $100,000 per job-year. I try to compare to estimates from developing countries, but very few firm programs have significant impacts on job creation, or cost data – see Appendix 8 for what I came up with.
- Analysis when the treatment affects business start-up/survival: The program had a large impact on start-up and survival. As a result, a simple comparison of business outcomes for the treatment and control firms in operation in a particular survey round will give a biased estimate of the treatment effect. I go with the solution of putting in zeros for firms that are closed down (they have zero profits, zero workers, etc.) and reporting unconditional estimates, and then looking at conditional estimates for exploratory purposes only.
- Why email in the sky is a good idea: after the winners were chosen they were verified and 18 were disqualified for one reason or another. I randomly chose 9 replacements when the first 9 of these were disqualified. However, 9 more disqualifications happened on a day when I was on a long plane ride, and given the need for a decision that day, program officials took 9 winners from the control group based on score, rather than randomly – next time I need to find a plane with wifi!
This blog originally appeared on the World Bank Development Impact Blog