
The map below is based on 14 years of remotely sensed measurements of airborne particulates. It shows unsurprising patterns in the distribution of air pollution across the globe. There are high levels of pollution in China, India, and sub-Saharan Africa. Agricultural burning in the Amazon is important for central South America. North America and Europe are relatively pollution free.
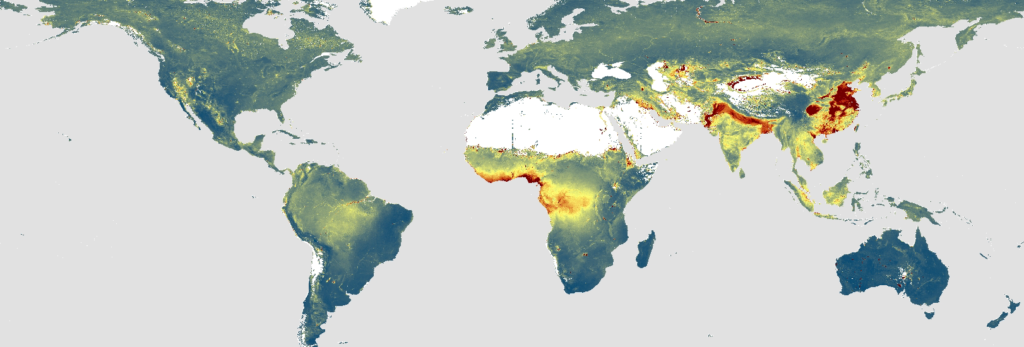 Mean Aerosol Optical Depth from MODIS, 2002-14. Aerosol Optical Depth is a remotely sensed measure of particulates. In this image, blue indicates less pollution and red indicates more pollution. Note the extremely high pollution levels in China and Northern India.
Airborne particulates are poisonous: the recent ‘Global Burden of Disease’ study found that air pollution kills about three million people every year. The literature has also carefully documented the effects of particular regulations on air pollution, like the Clean Air Act in the United States. However, we know much less about the causes of pollution exposure.
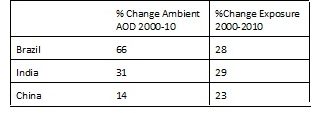
Consider the following table. In the second column, we calculate the percentage change in particulates for an average square kilometre in Brazil, India, and China between 2000 and 2010. In the third column, we calculate the percentage change in particulates for an average person in each of these three countries. An average square kilometre in Brazil saw particulates increase by 66% over this period, while an average person in Brazil saw an increase in particulates of only 28%. Reading down the rows, India saw an increase in both ambient particulates and exposure of about 30%, while China saw an increase in ambient particulates of about 14% and increase in exposure of about 23%. Brazil has therefore managed to keep polluting activities and exposure to people separate. India has seen them pretty well matched, while China has managed to bring people closer to polluting activities.
Table 1: A comparison of percentage change in particulates and exposure to particulates
What activities are associated with high levels of particulates?
Preliminary analysis of our data suggests the following. Somewhat surprisingly, particulate exposure is largely determined by country level policy. On average, knowing a person’s country of residence gives us at least as much information about their exposure as does knowing where they live in a given country. Coal consumption is by far the most important determinant of particulate exposure, with urbanisation also playing an important role. Together with wind data, our particulates data allows us to estimate flows of particulates across country boundaries. These flows seem to have less of an impact on pollution exposure as compared to coal consumption or urbanisation. Petroleum seems to be a minor factor while agricultural burning and fires seem to be relatively unimportant in most countries, though they are clearly important in a few. We have yet to investigate the role of construction and of agriculture on particulates.
Evaluating hypothetical policy responses
Table 1 above demonstrates the importance of location patterns for pollution exposure and invites the following sorts of queries about the role of mobility in determining patterns of pollution and exposure. Suppose that Brazil were to restrict rural fires in an effort to reduce air pollution. Would this reduce agricultural productivity and drive rural farmers into the more polluted cities? Could this reorganisation of people lead to a net increase in exposure? Similarly, if China restricted urban coal consumption, could the resulting improvements in urban air entice people to move from the cleaner countryside to the still dirtier city? Could this migration mean an increase in the total exposure to pollution?
To evaluate different hypothetical policy responses to particulates for countries around the world, we will develop and estimate an `integrated assessment model’, modelled around those used successfully to inform climate policy. Preliminary investigations suggest that probing the sorts of complicated equilibrium responses described above, may be important in understanding the implications of air pollution policy. When complete, our intention is to provide a tool with which policymakers can assess the cost-effectiveness of various policy responses to air pollution, such as regulating coal or agricultural burning, or managing agricultural and construction dust.
Concluding remarks
Understanding how pollution and the regulations intended to curtail it affect the distribution of people and production is important for economics policy, and ultimately, for its implications for economic growth. Urbanisation, industrialisation, and increases in human capital are all known to be essential components in the economic development process. However, just as pollution exposure undermines progress in human capital accumulation and labour productivity, preliminary analysis of our model and data suggest that poorly designed policies can exacerbate these harmful consequences of exposure and distort the allocation of productive assets. Understanding the determinants of equilibrium air pollution exposure and accounting for the spatial redistribution of people and economic activities are therefore important goals for both environmental management and economic growth.