
Do school electrification and provision of digital media deliver educational benefits?
Does school electrification affect educational achievement? Does jointly providing educational video affect educational achievement? A first of its kind study in Tanzania attempts to find answers to these questions.
There is a substantial gap in economic literature exploring the effect of school electrification on education achievement. Recently, a cross-sector partnership, known as the GivePower school programme, has enabled a study on such a topic to take place in Tanzania.
Tanzania
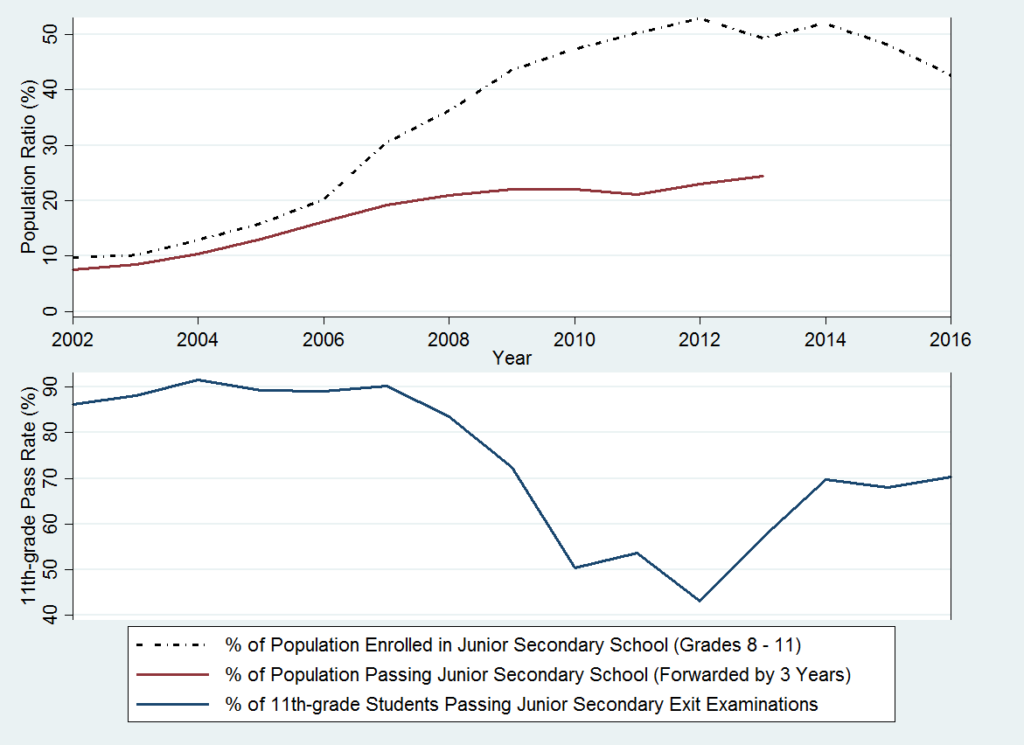
With a population of 56 million and the 5th-fastest growing economy in the world, Tanzania is an important economic hub in East Africa. However, when it comes to development indicators, it lags behind other developing countries on some counts. According to the most recent World Bank estimates, only 16% of population has access to electricity. Not many youths are succeeding in completing secondary education. Among youths who should have been entering junior secondary school (years 8-11) in 2010-2013, less than 25% managed to graduate by 2016. The pass rate on the O-level (year 11) exit examinations, a major policy target of the Tanzanian government, remains at 70% (Figure 1).
Figure 1: Pass Rates and Population Ratios in Tanzanian Junior Secondary Schools, 2002-2016
The study
In 2015, the GivePower Foundation, a US-based clean-energy nonprofit, partnered with Off Grid Electric, a solar energy provider with large-scale operations in Africa, to provide solar systems to hundreds of schools. Each donation was able to light approximately 20% of classrooms and offices in each school. A research partnership was formed to study the following two questions:
- Does school electrification affect educational achievement?
- Does jointly providing educational video affect educational achievement?
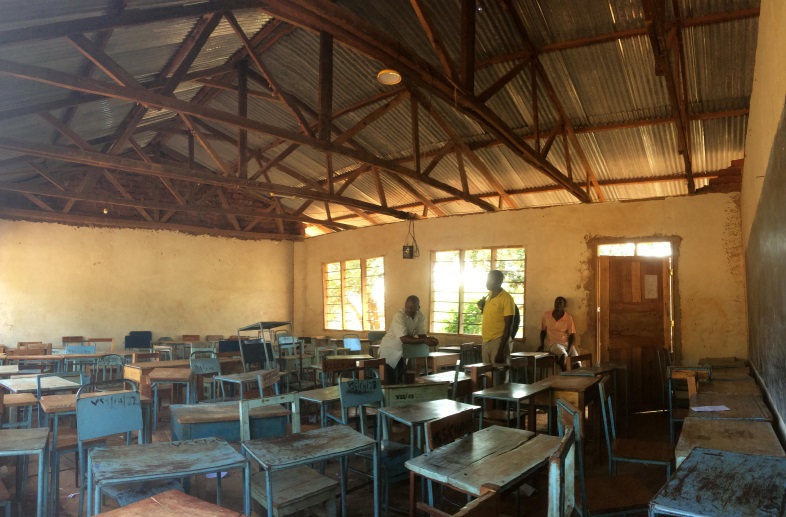
The programme randomized 164 schools into six groups: G1 schools received two solar home systems including lights and TVs (referred to as facilities); G2, solar facilities and English videos; G3, solar facilities and bilingual videos; G4, English videos only; G5, bilingual videos only; and control schools (Figsure 3). Control schools refer to the group of schools who received nothing as part of the programme. Videos included two sets: one set solving the past 10 years of biology and geography exams; another set encouraging self-esteem, habit formation, future orientation, and other cognitive-behavioral character traits. Schools not receiving the solar facilities were promised to be provided the same facilities at the end of 2017.
(a) Solar Lights
(b) Solar TV
[caption id="attachment_25011" align="alignleft" width="685"]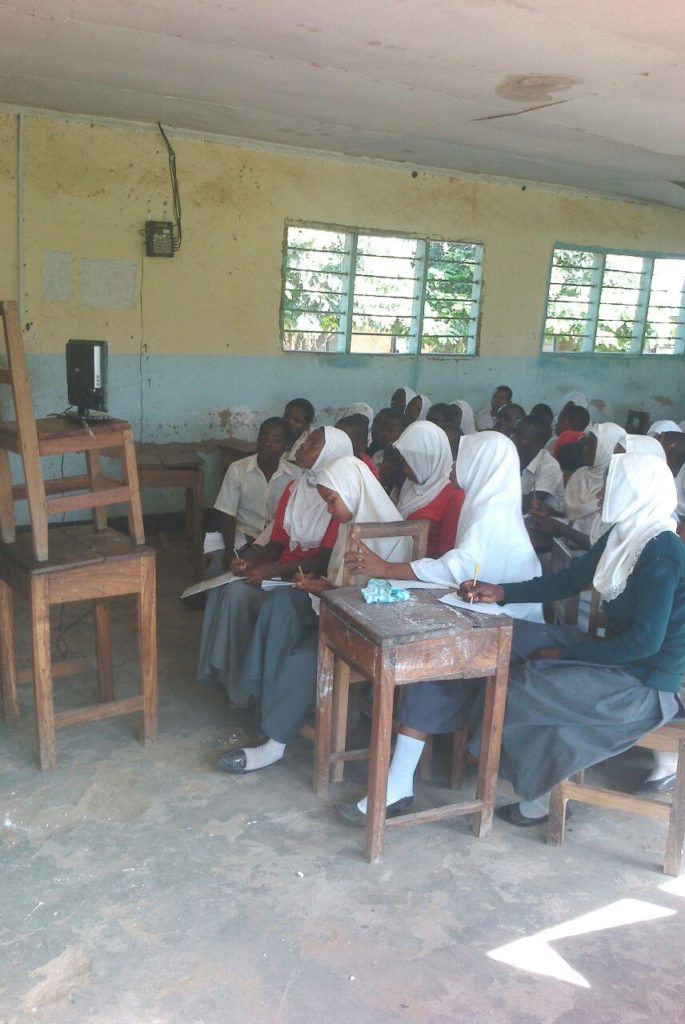 Note: Subfigure (b): Solar home systems came with 3 different types of lights, 6 lights per system, 12 lights in total across two systems provided. Subfigure (d): The systems also came with one 16" and one 19" solar TV. See the following link for videos: https://www.youtube.com/playlist?list=PLWjakPMOMQnW3w57jnh3AIIFjcL2y170z.[/caption]
Findings
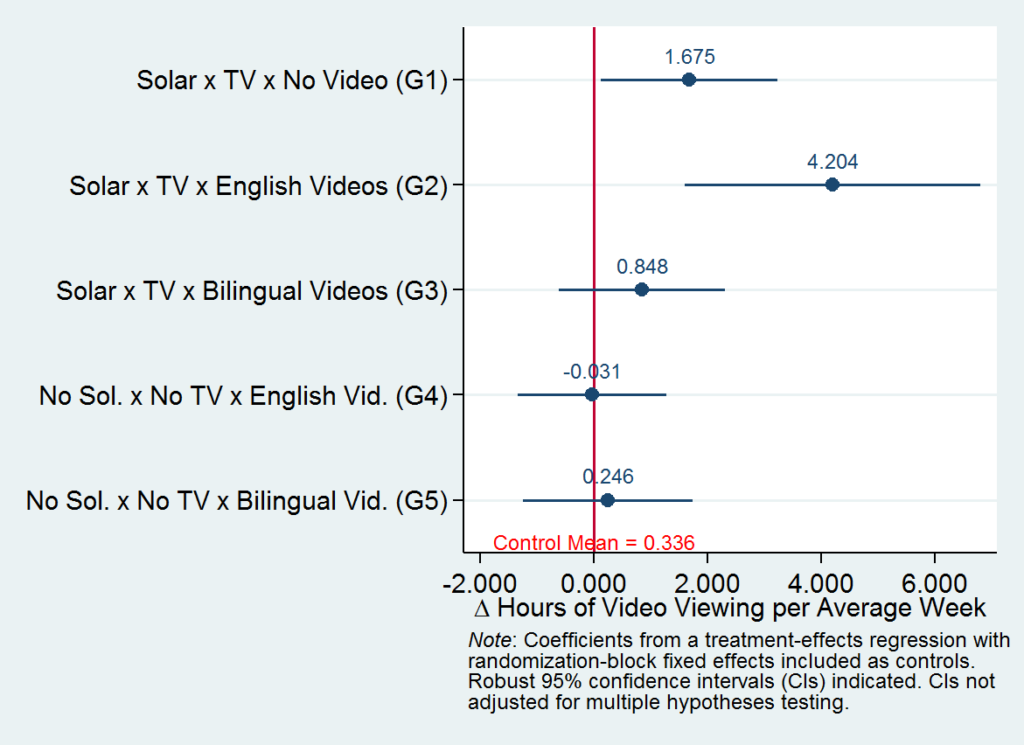
After one year, the treatments i.e. solar facilities and/or videos did not produce significant achievement gains. However, G2 schools (solar and English videos) reported large and significant increases in video-viewing hours, and G3 schools (solar and bilingual videos) suggested the highest test score gains (Figs. 3 & 4).
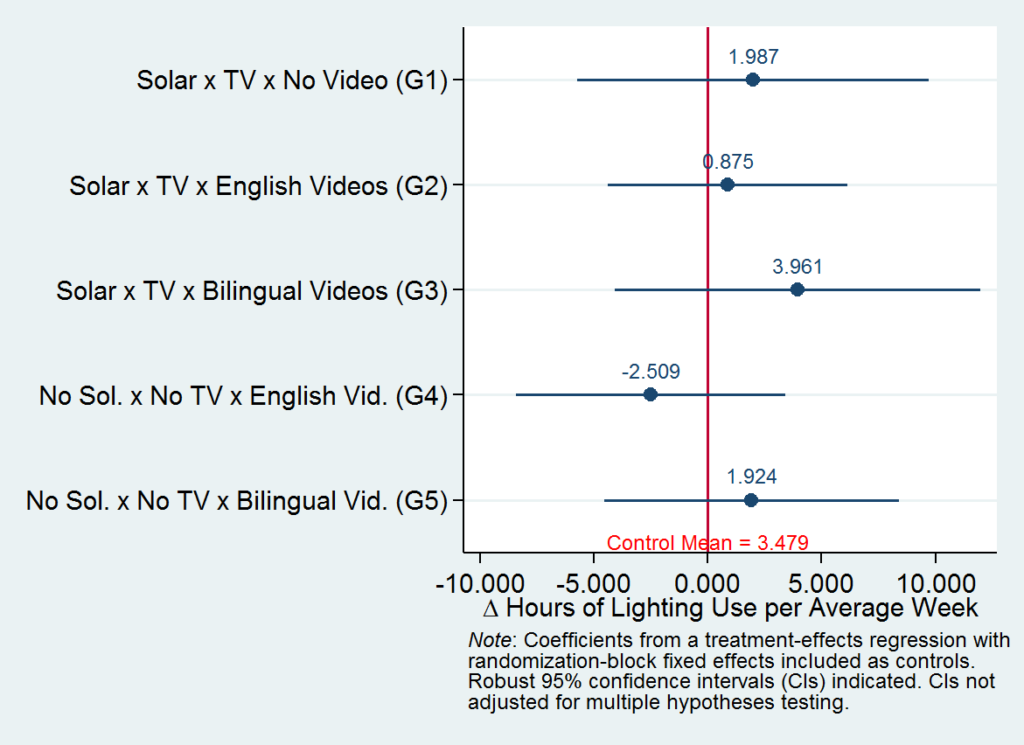
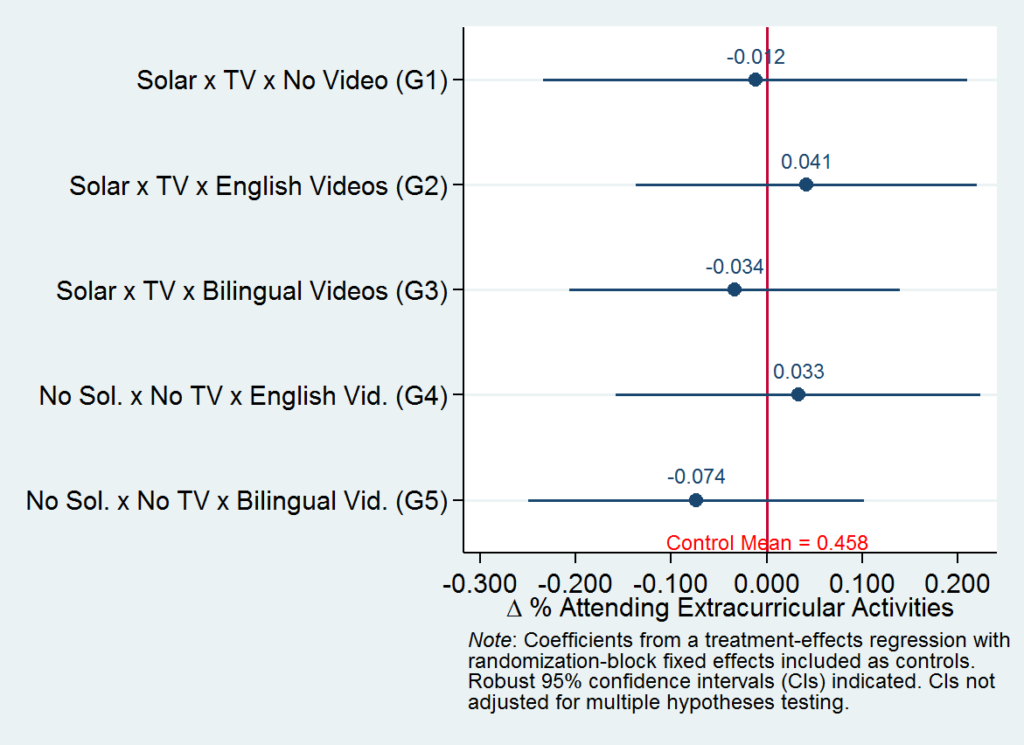
Figure 3: Programme Impacts on Pedagogy and Educational Time Use
(a) Hours of Video Viewing per Average Week
(b) Hours of Lighting Use per Average Week
(c) % Students Attending Extracurricular Activities
(d) % Students Staying Late to use Electricity
[caption id="attachment_25016" align="alignleft" width="1024"]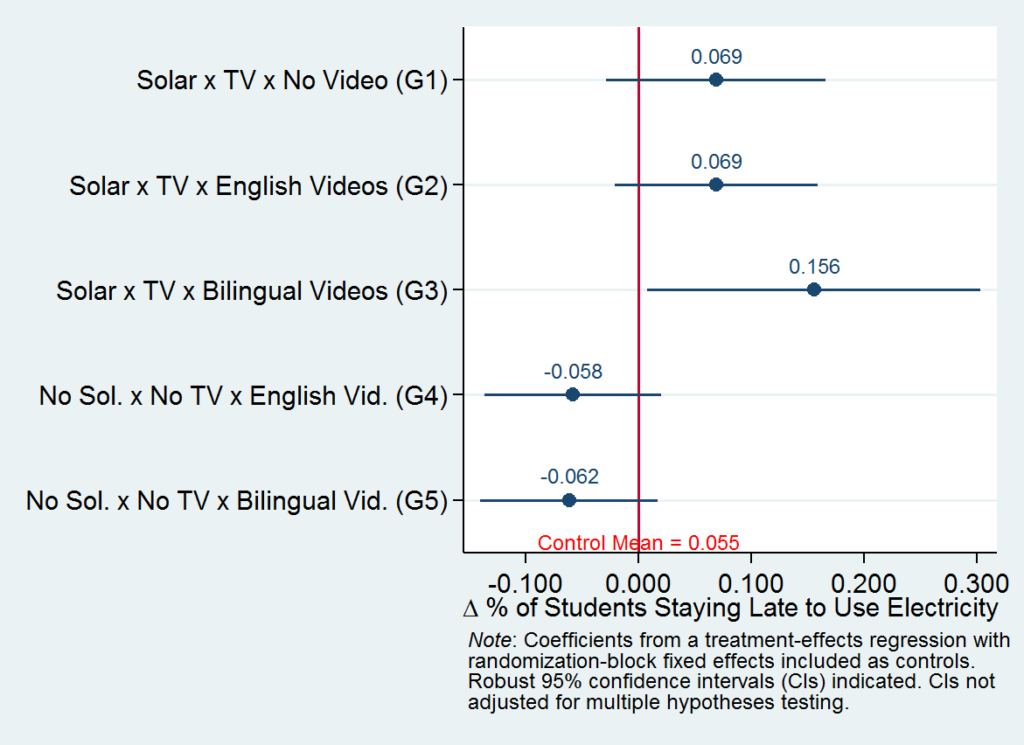 Note: Responses were collected on a survey of school administrators conducted in October, 2016. Subfigure (a) and (b) examine total hours spent watching video and using lights during planned hours (regular and extracurricular hours) in an average week, respectively. Subfigure (c) examines the percentage of students attending extracurricular activities in an average week. Subfigure (d) examines the percentage of students (all grade levels) using electricity after regular hours in an average week.[/caption]
Figure 4: Impact on Outcomes
[caption id="attachment_25018" align="alignleft" width="623"]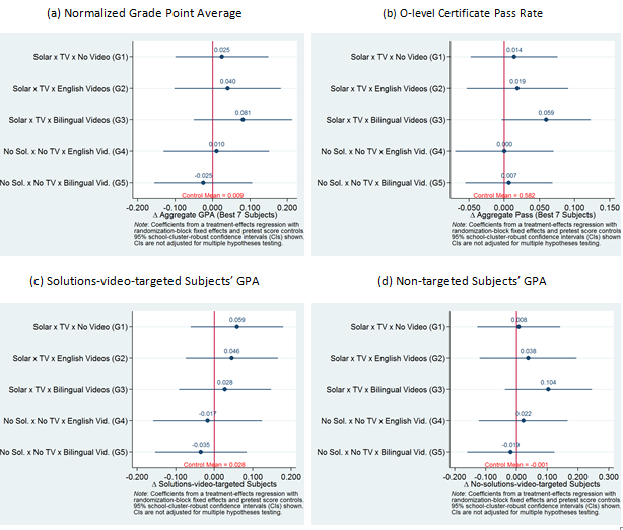 Note: Observations are 10,171 takers of the junior-secondary exit examinations (11th-grade O-levels) in November, 2016. Subfigure (a) examines normalized grade-point average (GPA) across a student's seven best subjects (used by the government to determine certification); subfigure (b), indicator for passing junior-secondary school (or Division IV certification, whose threshold is getting at least two D's). In subfigures (c) and (d), the GPAs are across solutions-video-targeted subjects (geography and biology) included in the best seven, and non-targeted subjects included in the best seven, respectively. School-cluster-robust 95% confidence intervals indicated. See working paper for regression specifications and other details.[/caption]
Averaged across video-provision status, solar-facilities-enabled programmes raised video-viewing hours per week by 2.3 hours. They also raised gross attendance per week to use electricity after regular school hours by 14 percentage points. Solar box scan data suggested that schools used 17.4 hours of energy across the two boxes provided per day, mainly as security lights. Estimates of average achievement gains were statistically insignificant, meaning that (in its first year) we cannot conclude that the programme achieved its goal of improving educational achievement.
Limitations
In the first year, the programme showed clear limitations. Giving lights and videos were not enough to elicit significant achievement gains. Video-viewing hours were not helpful for raising test scores, although schools increased video-viewing hours in response to the interventions. Schools did report that many students showed willingness to remain behind in school to use electricity after regular curriculum hours. These results suggest that in the sub-Saharan junior secondary educating setting, motivating students with more opportunities to actively engage and struggle with the materials themselves, and making these materials more approachable and conducive to self and group-study, may constitute more effective policy than encouraging passive viewings of videos alone. The ineffectiveness of videos may be highlighting both the limitation of video-based instruction at the secondary level, and the importance of human interactions and the role of teachers in the fields of education and mentorship.
It may be the case that longer-term (two-year) results are different from the first year’s results. Second (final) year results are being awaited, whose examinations will be taken at the end of 2017 and results announced in 2018.