
Do subways improve urban air quality?
Data from around the world show that a new subway system can improve air quality in highly polluted cities.
Air pollution is a major threat to human health and the climate. According to the World Health Organization, 90% of the world’s population is exposed to harmful pollution levels and about seven million people die prematurely each year as a result (WHO 2020). Due to traffic congestion and the damaging effects of air pollution (Chay and Greenstone 2003, Anderson 2020), cities around the world are under pressure to implement policies that improve urban air quality. Many turn to the construction of mass rapid transit systems in the hope of reducing the use of cars and motorcycles and the pollution they cause.
The logic of why subways might reduce air pollution is straightforward: substituting trips using fossil fuel-burning vehicles for trips on subways reduces emissions. However, a subway may find few users or only provide short-lived congestion relief, as non-subway users take advantage of reduced congestion to make more trips by car.
The effect of subways on air pollution is fundamentally an empirical question. The best evidence we have so far on the relationship between subways and air pollution was based on the experience of a single city – Taipei – in the first few weeks after a new system’s inauguration (Chen and Whalley 2012). In contrast, in our research paper (Gendron-Carrier et al. 2020), we study all of the 58 subway openings and 143 expansions that occurred anywhere in the world between August 2001 and July 2016. In analysing the effects up to four years after the intervention, we dramatically improve our understanding of the relationship between subways and urban air pollution.
Characteristics of new subway systems
Cities that opened a new subway system during our sample period have an average population of four million people. They are located predominantly in middle-income countries (average GDP per capita of US$18,000, PPP adjusted). The average length of time from plan approval to opening is 11 years, with construction taking an average of six and a half years. On average, new subway systems start out with 14 stations and, 18 months after opening, provide about 130,000 trips daily. Figure 1 shows the evolution of ridership per thousand people in a city in the first five years of service. The figure shows a stabilisation of levels after about three years, with subways providing around 60 daily trips per 1,000 people in a city, on average.
Figure 1: Daily ridership per capita
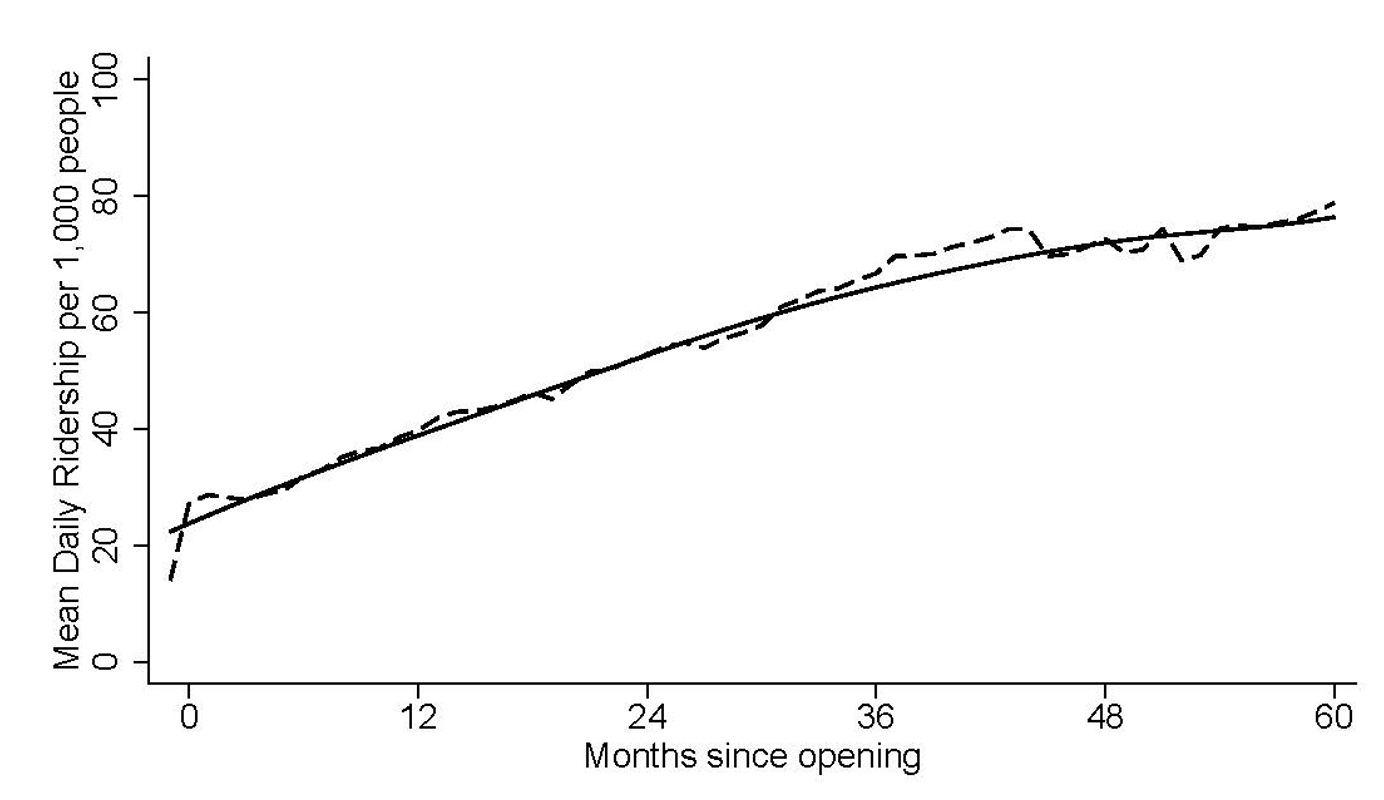
Note: Figure depicts average daily passengers on subway per 1,000 people in metropolitan area, as well as a locally weighted regression of the series.
Testing the impact of subways on air pollution
One major challenge for our study was that ground-based air quality data in many parts of the world are incomplete – especially in developing countries – and reporting is not standardised across countries and over time. To overcome this challenge, we rely on a remotely sensed air quality measure reported by NASA’s Terra and Aqua satellites from February 2000 to present. The measure of particulates we use is called Aerosol Optical Depth (AOD) which has been widely used for global particulate assessments (see Van Donkelaar et al. 2010). These data sources provide a consistent monthly measure of airborne particulates everywhere in the world with approximately three kilometres spatial resolution. To illustrate, Figure 2 presents a map showing average AOD over 2017 from the Terra satellite where darker shading indicates higher AOD readings.
Figure 2: Worldwide AOD, 2017, Terra Satellite
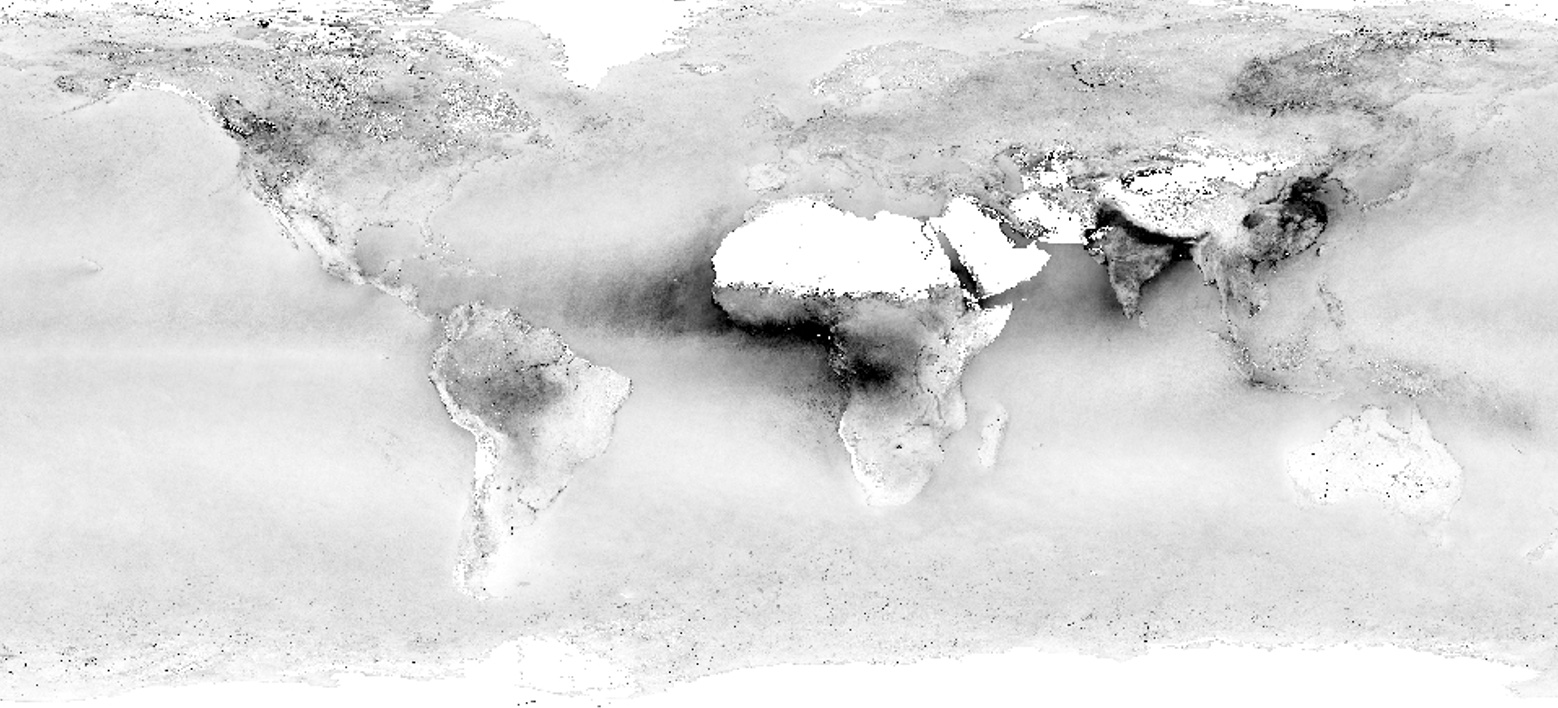
Note: Darker colours indicate higher levels of AOD. Missing data are marked in white.
Our main outcome of interest is mean monthly air pollution, as measured by AOD, inside a 10km disc with centroid in the city centre. We also consider other-sized discs and air pollution just within a city footprint, determined using night-light satellite data. Using a large geography is important since we are interested in capturing citywide changes, not just localised effects (for example, around subway stations). Figure 3 illustrates the AOD data for Palma, Spain in June 2017. The large circle in this image is 25km in radius and the small white circles represent subway stations that were completed by the end of the study.
Figure 3: AOD in Palma, June 2017
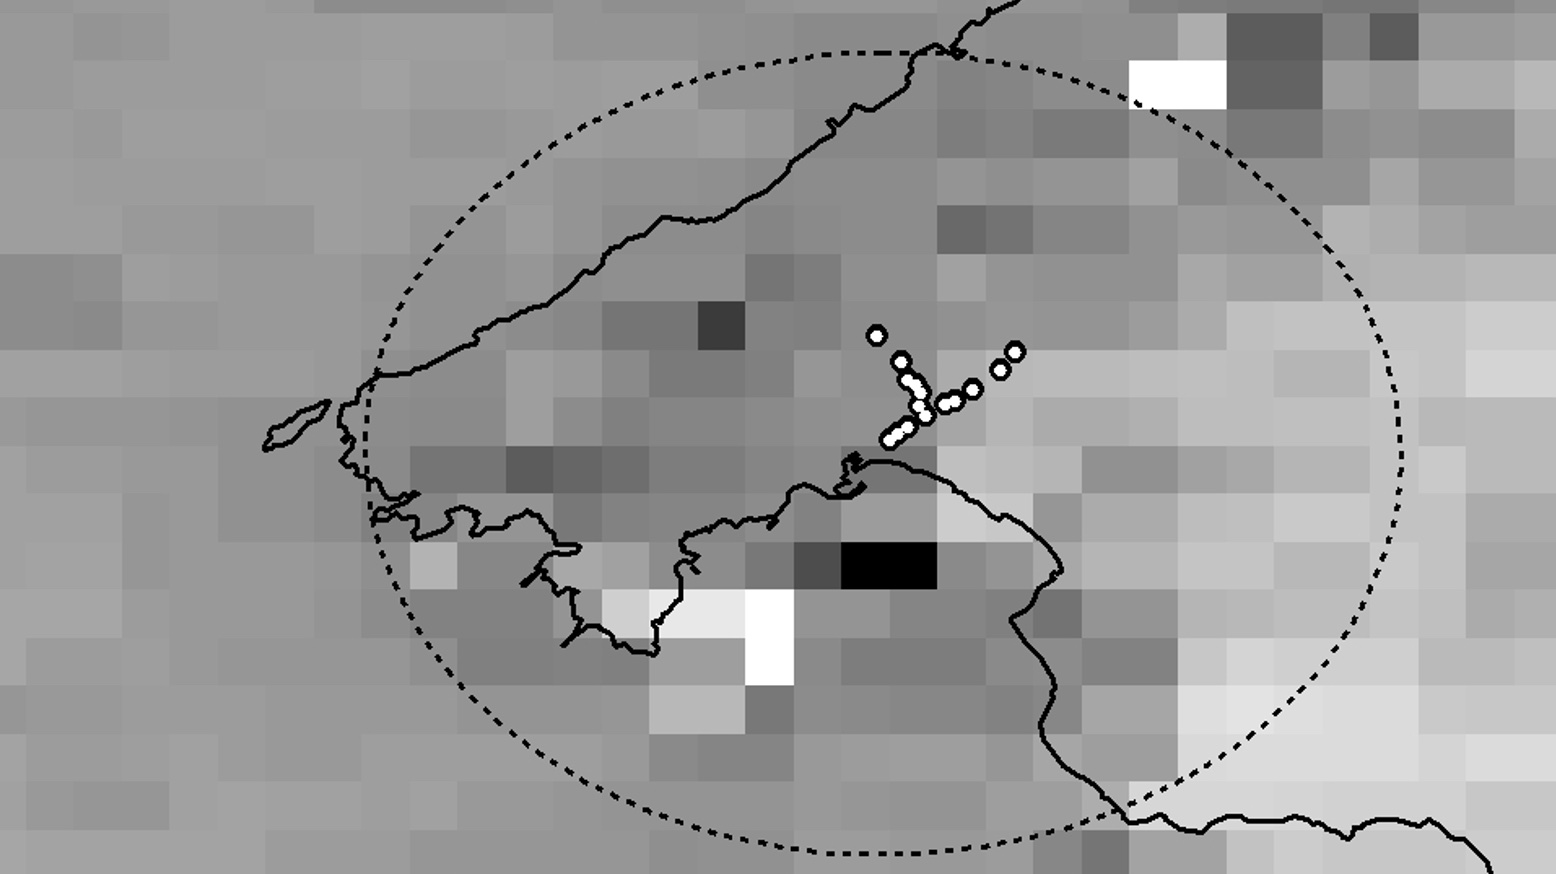
Note: Terra AOD for Palma, Spain, in June 2017. Darker pixels indicate areas where AOD is higher and white pixels indicate missing values. The large circle has a radius of 25 km and is centred on the central business district. Subway stations as of December 2017 are shown as small white circles.
To test whether air quality improves meaningfully once a subway opens, we compare changes in air quality within a city around the time of a new subway opening, controlling for seasonal effects, climate variables, and regional pollution trends.
Which cities see improvements in air quality after a subway opening?
In our sample, an average subway opening resulted in a small improvement in air quality during the 18 post-opening months relative to the 18 pre-opening months. This decrease in airborne particulates cannot be statistically distinguished from zero.
This approximately zero average effect, however, conceals considerable heterogeneity across cities. We looked for patterns explaining this heterogeneity by incomes per capita, city topography, wind patterns, city population, the relative size of subway systems, and other city attributes.
We did not identify meaningful heterogeneity along various dimensions save one – the 23 cities where subways improved air quality are overwhelmingly among those whose initial level of AOD was above the median at baseline. For the set of cities in the top half of the initial air quality distribution — those with average PM2.5 levels above approximately 28 µg/m3 in 2000 — air quality improved by about 4% after the subway opening.
In Figure 4, we show the air quality change estimates for each of the 58 cities in our sample as a function of baseline AOD levels. The red line makes clear that cities with higher initial levels of AOD tend to have larger declines in particulates once subway service began.
Figure 4: Treatment effects and initial AOD levels
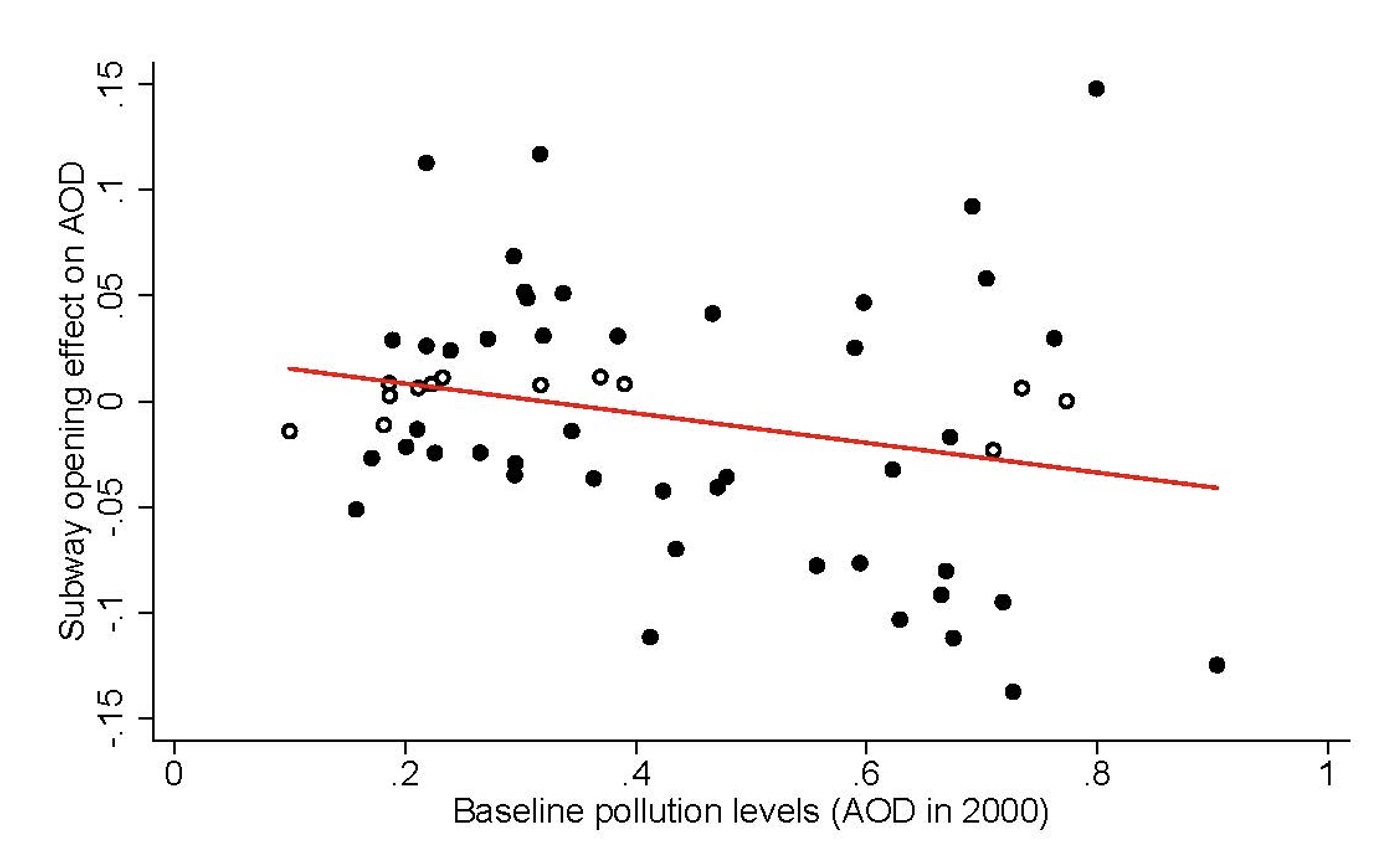
Note: Figure shows the 58 city-specific subway effects as small circles. Dark dots are significant at the 5% level. The horizontal axis shows initial AOD level in 2000, the vertical axis shows coefficient magnitudes. The solid line shows a linear fit of the dots. Standard errors clustered at the city level.
As would be expected, we find that the air quality improvement effect among initially highly polluted cities is larger near the centre of cities where subway service is usually concentrated. We cease to find significant pollution effects beyond 25km from the city centre.
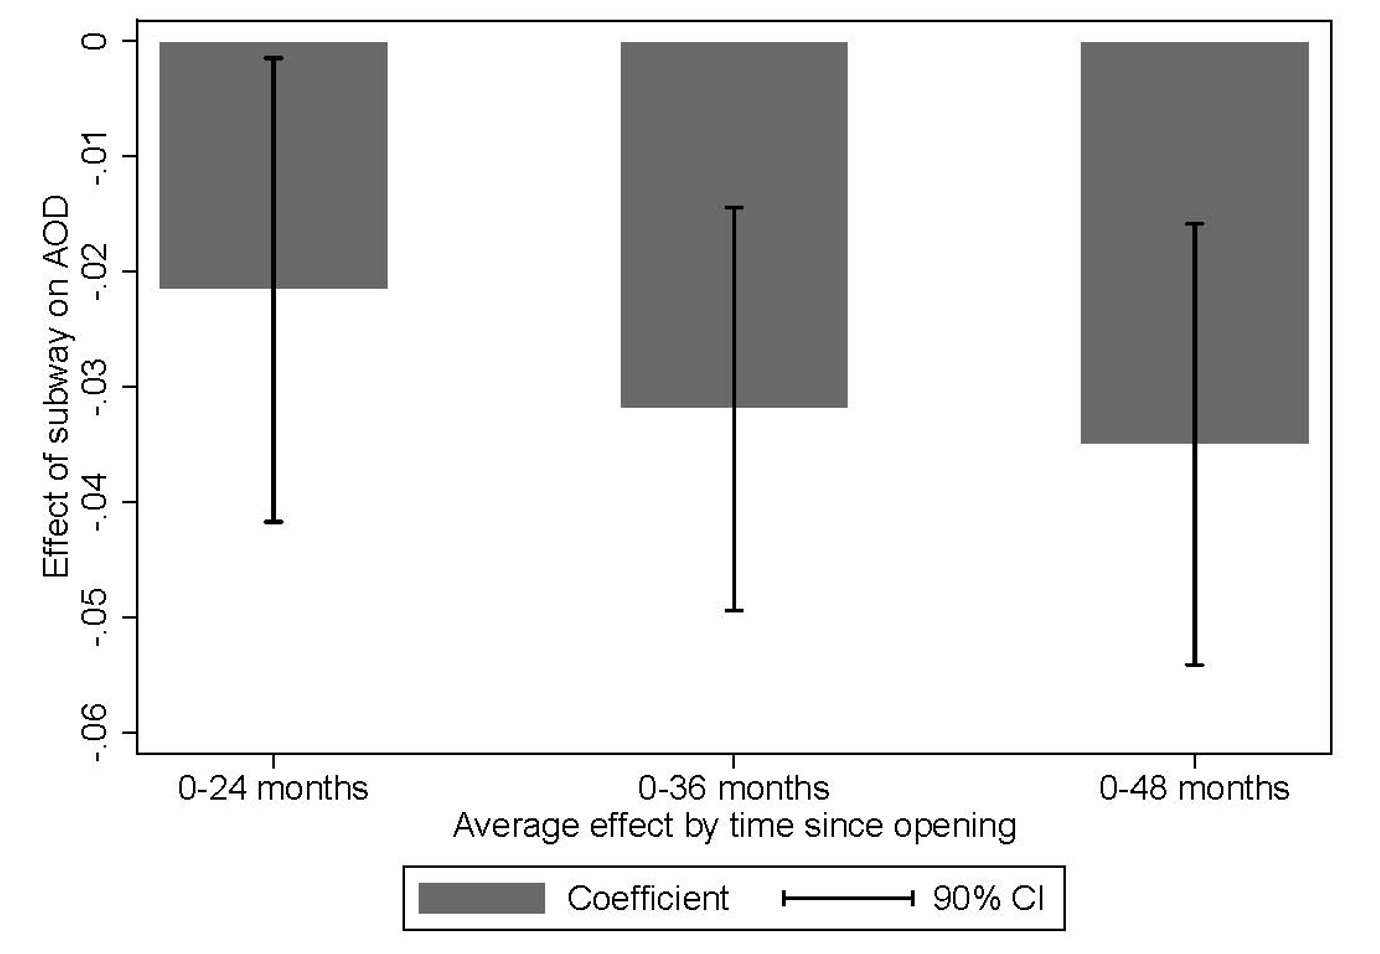
Our data also allow us to investigate whether these air quality improvements are short lived or not. Figure 5 shows average effects among high AOD cities as the window of analysis becomes longer. Effects do not decline – in fact, the 4% decline in AOD persists for at least four years after the opening of a subway.
Figure 5: Long-run effects of subway openings in high AOD cities
The data also indicate that subway ridership is highly correlated with AOD reductions. That is, cities where AOD fell significantly are also those in which ridership, and hence automobile substitution, were largest. This is important. Deliberations about subway placement tend to favour places where it is easier to build a subway (for example, where there is space) and not necessarily where demand for travel is highest (for example, in the densest areas of a city), precisely because it is more cumbersome to build there.
How much should cities value this improvement in air quality?
Our estimates of the reduction in pollution following a subway opening in a high AOD city, together with existing estimates of the health implications of particulates (Arceo et al. 2016), allow us to calculate the value of averted mortality that follows from a subway opening.
For cities in the lower half of the AOD distribution, the effect of subway openings is small and not distinguishable from zero. However, we estimate that for an average city initially in the top half of the AOD distribution, a subway opening prevents 22.5 infant deaths and 500 total deaths per year. Using standard income-adjusted life values, this averted mortality is worth about $43 million and $1 billion per year, respectively. These estimates do not include the effects of particulate reduction on morbidity or on productivity, and so probably understate benefits.
Does this mean subway construction and operation subsidies are justified? Although available subway capital cost estimates are crude, the estimated external health effects represent a significant fraction of construction costs, but only for subway systems with costs at the low end of the observed range.
This article first appeared on VoxDev (you can see the original here) and is based on this IGC project.
References
Anderson, M (2020), “As the wind blows: The effects of long-term exposure to air pollution on mortality”, Journal of the European Economic Association 18(4): 1886-1927.
Arceo, E, R Hanna, and P Oliva (2016), “Does the effect of pollution on infant mortality differ between developing and developed countries? Evidence from Mexico City”, Economic Journal 126(591): 257–280.
Chay, K and M Greenstone (2003), “The impact of air pollution on infant mortality”, Quarterly Journal of Economics 118(3): 1121–1167.
Chen, Y and A Whalley (2012), “Green infrastructure: The effects of urban rail transit on air quality”, American Economic Journal: Economic Policy 4(1): 58–97.
Gendron-Carrier, N, M Gonzalez-Navarro, S Polloni, and M Turner (2020), “Subways and urban air pollution”, forthcoming in American Economic Journal: Applied Economics.
Van Donkelaar, A, R Martin, M Brauer, R Kahn, R Levy, C Verduzco, and P Villeneuve (2010), “Global estimates of ambient fine particulate matter concentrations from satellite-based aerosol optical depth: Development and application”, Environmental Health Perspectives 118(6): 847-855.
World Health Organization (2020), “Air pollution”.