Good governance through spatial evidence-based planning
Without a guiding framework, public spending in Balochistan, Pakistan remains ad-hoc and weakly aligned with the development needs of the province. The province could benefit from a spatial approach that links investments in its future development with present spatial realities.
The government of Balochistan is working towards developing such a spatial strategy and – with research support from the International Growth Centre – piloting its first ever decision support tool to operationalise this strategy.
In a fiscally restrained environment, there is mounting pressure on provincial governments to respond to both the immediate needs arising out of the COVID-19 crisis and to continue managing and containing costs of service delivery. Policymakers and planners are often beset by numerous competing and conflicting demands around service delivery to meet the needs of the population. While ensuring coverage for a dispersed population, especially in a province like Balochistan, it is important to rationalise public investments and allocate resources according to the needs of both rural and urban areas.
There is a growing emphasis on well-informed public planning and perceptive resource allocation. Decision-making must be grounded in reality, iterative, forward-looking, goal-oriented, and structured. Policymakers must have access to the data required for evidence-based policy decisions. They require a tool that enables them to draw from and integrate existing data and configure and model various options in service delivery allocations. A spatial decision support system (SDSS) that relies on spatial data can provide this capability.
What is a spatial decision support tool?
Spatial data is data that is connected to a location, i.e., in a specific a place on the earth. Any kind of spatial decision-making uses geographic data. An SDSS merges spatial and non-spatial data, uses specific decision models, and computes an optimal solution or many solutions along with trade-offs. Such a system can support decision-making around site selection, resource allocation, routing, service delivery/coverage , to name a few, and can be an important tool for policy.
Decision tools have become more feasible since big and open source spatial and non-spatial data has become increasingly accessible and started replacing traditional decision support tools. Compared to conventional tools, an SDSS relies more extensively on relevant external data than just internal organisational/administrative data. An advanced level of DSS, in addition to the provision of real time data, can also help in predictive and prescriptive data analytics by building scenarios, providing options, and sensitivity analysis, leading to optimum investment decisions.
For example, government departments across Pakistan typically conduct location analysis to build primary schools or basic health units. The inclusion of external data like detailed road networks, demographic and utility data can greatly enhance the quality of decision-making to identify feasible locations. Such data also provides a richer representation of valuable spatial problems. Without integrating these sources of data, governments may end up building a school where road infrastructure is poor. Moreover, integrated data sets also discourage politically driven investments and help align public investments with real development needs across different regions and sectors.
Piloting for Balochistan
The IGC’s first engagement in Balochistan supported the provincial government in developing the contours of a spatial strategy, what it would entail and what kind of data would be needed to support it. A natural progression in the process of implementing this strategy was an IT-based DSS with the objective of supporting evidence-based and responsive decision-making. This system can provide real-time integrated data for multiple sectors, enabling policymakers to develop an improved and more comprehensive framework of development needs, identify potential impacts of policy interventions, and undertake future investments.
A key development sector in Balochistan is infrastructure. Infrastructure planning is a complex task involving large investments as part of the public expenditure portfolio, and has important social, economic, and environmental impacts. It is also acknowledged as a major driver of economic growth. The pilot SDSS for road infrastructure in Balochistan was built using a range of information from multiple data sources to encourage a data-driven approach towards planning for infrastructure projects.
Using data effectively
The primary tool to help planners untangle the complexities of regional planning is data in the form of administrative boundaries, population clusters and densities, connectivity and mobility via roads, railways, and airports, natural resource distribution, industrial clusters, distribution of built-up area versus agricultural land, as well as population demographics. This data must be used in conjunction with maps and other forms of spatial analysis to allow spatial visualisation and coordination. The SDSS for Balochistan relied on the data sources shown in table 1.
Table 1: Data sources for Balochistan
| Data (Layers) | Source | |
| 1 | Population | Block level spatial data from PBS |
| 2 | Road network (National Highways, Motorway, Intercity) | National Transport Research Centre |
| 4 | Railway line, Railway stations | Board of Investment Interactive Map (https://invest.gov.pk/interactive-map) Wikipedia, OSM, Google Maps |
| 5 | Airports | Board of Investment Interactive Map (https://invest.gov.pk/interactive-map), UN-OCHA, OpenStreetMap (OSM), Google Maps , |
| 6 | Dry ports | Board of Investment Interactive Map (https://invest.gov.pk/interactive-map), UN -OCHA, OpenStreetMap (OSM), Google Maps , |
| 7 | Human Settlements, land cover, built up area, forests etc. | Open source spatial databanks - Extracted from satellite images |
| 8 | Education facilities (University, College, Schools) | Education Department http://emis.gob.pk/Views/Gis/FrmGis3.aspx |
| 9 | Provincial Assembly Boundary | ECP https://www.ecp.gov.pk/frmGenericPage.aspx?PageID=3142, https://data.humdata.org/dataset/provincial-regional-constituency-boundaries-pakistan |
| 10 | Health Facilities (DHQ, THQ, BHU) | Health Department - A public dataset available on UN –OCHA spatial databank |
| 11 | Special Economic Zones | Board of Investment Interactive Map (https://invest.gov.pk/interactive-map) The locations digitized using google earth/map. |
| 12 | Administrative Boundaries (District , Tehsil) | Open source spatial databanks |
| 13 | CPEC Routes | National Highway Authority Interactive Map |
| 14 | Expenditure on road sector for last 10 years | P&D department, C&W |
Typically, spatial analysis starts with a base map, or layer, upon which multiple other layers are applied. In this case, the base layer was the borders of Balochistan, atop which layers showing administrative boundaries at the district, tehsil, and where possible, mauza (district) level were applied. Visualising data points like population, income, housing stock, connectivity, industrial and agricultural growth, and the spread of public services like health and education can enable policymakers to effectively gauge how the region is evolving, what is impeding economic and social development, and how future changes might affect inhabitants.
Mapping of human settlements, or population clusters, was critical as there is limited analysis of population densities, distribution, and human settlement patterns across Balochistan. A population density map using census data at the lowest administrative level would help the government identify the size and distribution of population clusters, evaluate the most appropriate unit for service delivery, and plan for compact growth in the future. Overlaying population data with other data layers (housing, health, education) further help the government develop appropriate strategies for service provision, infrastructure development, and long-term growth. Likewise, a population growth map with projected population figures and breakdowns by age can support government’s planning efforts.
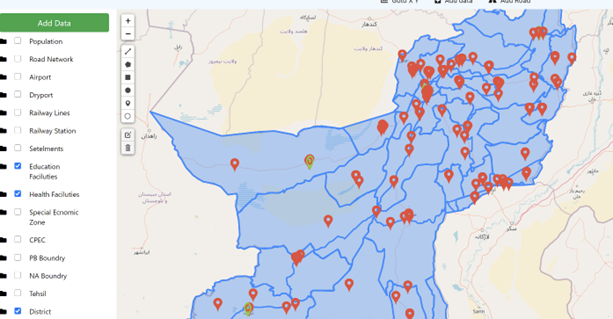
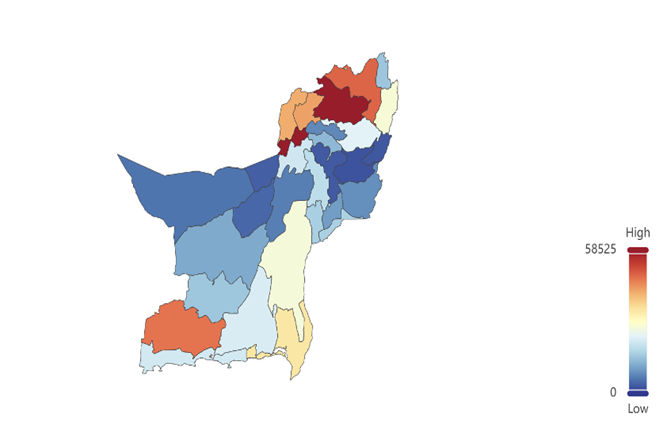
As shown in Figure 1, the interface is usually a simple dashboard which allows multiple levels of access to different categories of users. The pilot system can allow policymakers visually see how services are being distributed across the province. By generating simple heat maps, it is also possible to see which districts have the most road infrastructure expenditure, as shown in Figure 2.
Figure 1: Dashboard of DSS

Figure 2: Heat map of district-wise infrastructure project expenditure

More complex analysis can also be performed. The pilot SDSS provides data to simplify the process of decision-making around investments linked to road infrastructure projects. It does so by assigning a score to a potential scheme across a list of criteria. A summary version of such a scoring system is displayed in table 2 below.
Table 2: Summary scoring system
| Scoring Factors | Criteria | Score | Weightage | |
| Basic | District Development | Road to Pop & Area | Inverse ratio | 20% |
| Population | 1000 / sq km | Min 10 – max 100 | ||
| Right of Way | Existing or Not | 10 – 100 (pro-rata) | ||
| Connectivity | Linking other roads | Variable on Size of Road | 10 for none 20 Point per Local Road 40 Point per Secondary Road 60 Point per Primary Road 80 Point per Highway 100 Point per Motorway/ Expressway |
30% |
| Inter City Bus Terminal | Presence & Distance from road | 10 for none 50 for presence + 50 for distance in Km( 10/km) |
||
| Railway Station | Presence & Distance from road | 10 for none 50 for presence + 50 for distance in Km( 10/km) |
||
| Airport | Presence & Distance from road | 10 for none 50 for presence + 50 for distance in Km( 10/km) |
||
| Dry Port | Presence & Distance from road | 10 for none 50 for presence + 50 for distance in Km( 10/km) |
||
| Economic Hotspots | Agricultural area | Acres / Sq Km | 10 for zero 20 for 100 acres 30 for 200 40 for 300 Max 100 |
30% |
| Industrial Area | Min 10 Ind | 10 for one unit 10 for each unit..max 100 |
||
| Commercial Zone | Presence & Distance | 50 for presence 50 for distance (inverse) |
||
| Mines & Minerals | Area in acres / sqkm | 10 for 10 sq KM Max 100 |
||
| Social Services | Education | Number & Distance | 10 per facility; max 50 50 for distance (inverse) |
20% |
| Health | Number & Distance | 10 per facility; max 50 50 for distance (inverse) |
||
| Entertainment | Number & Distance | 10 per facility; max 50 50 for distance (inverse) |
||
| Public Offices | Number & Distance | 10 per facility; max 50 50 for distance (inverse) |
||
| Total: 100 |
This will then produce a summary result like the one shown in Figure 3. By setting a threshold, the score can help decide whether this spending is worth considering.
Figure 3: Summary result

Challenges ahead
Existing data would only be beneficial if it can be combined with new primary data, and many policy questions will only be answered by combining new data with existing data such as demographics. It is unlikely, however, that much of this data will be readily available, especially in the form of spatial datasets across all sectors. As result, most of this will have to be collected or generated by using tools such primary and secondary data collection, image processing, remote sensing, and the use of Big Data generated by mobile phone usage and geographic information system (GIS) based digitisation to demarcate tehsil and mauza boundaries.
The size of the challenge that simply collecting and/or generating data presents is substantial. The key decisions here include how to collect new data, optimise the use of existing datasets and develop skills and human resource capacity to not only collect and collate data, but also maintain and regularly update it. Sharing, accessing, and merging data from various departments can also be a challenge, and data collection is an overall cost-intensive procedure.
An important caveat to keep in mind while collecting data and developing the tool is that the benefits of more data do not always outweigh the costs. As such, all efforts towards data collection must be guided by specific policy questions and supported by stakeholder buy-in throughout – conditions fundamental for the success of any policy tool meant to help the government make better decisions.

