
Projecting emissions: Assessing strategies to protect the planet and the poor
While the poorest countries should prioritise climate resilience, fast growing economies must better complement growth with strategies to reduce emissions.
Growth, poverty, and climate change are possibly the three most crucial considerations guiding development aid discussions. Thus, green growth strategies for lower-middle and low-income countries must be responsive to the synergies between green growth and poverty.
We analyse projected emissions to 2050 and find that without any sustainable growth strategies in place, lower-middle income countries will contribute significantly to global emissions. As most of these countries have high levels of poverty, green growth should be complemented by policies to counter the adverse effect growth has on the poor in the medium term. Similarly, pro-poor growth policies should be prioritised in low-income countries—home to high poverty rates but also lower contributions to global emissions.
Trending toward increased investment in green growth strategies
The OECD broadly defines green growth as economic growth and development without any degradation of the environmental or natural resources that human wellbeing relies on. There is an increasing push for ‘Greening Overseas Development Assistance,’ as tracked by OECD, and evidenced by the commitment of the UK government to double international climate finance in the next four years. For example, the FCDO recently announced a strong climate and biodiversity portfolio for 2021 and pledged to deliver more than £941 million worth of activities to help meet International Climate Finance targets. This suggests that more development aid will focus on green growth strategies in the coming years.
The linkages between green growth and poverty alleviation are not without risks
As climate change trends as one of today’s most critical development issues, addressing it depends heavily on growth. Growth, in turn, determines level of extreme poverty. For example, carbon emissions increased in Asia as extreme poverty decreased from 1981 to 2011. In the same period in sub–Saharan Africa, emissions reduced but the number of people living in extreme poverty increased.
Examining the effect of green growth on poverty, the most obvious path is through adaptation, where better economic conditions will help build resilience of the most vulnerable to the effects of climate change. On the climate change mitigation side, green growth policies can impact the poor through livelihoods and energy access. However, in the short to medium term, this impact can be detrimental, unless corrected by social protection and redistribution policies. Environmental regulation is also often costly to the poor, where a shift from less labour intensive production to more technologically and capital intensive growth and environmentally sensitive investments, such as promoting local food self-sufficiency, do not necessarily help pro-poor growth.
An inverse relationship between levels of carbon emissions and the risks of climate change between rich and poor countries
While it is true that extremely poor people most likely care more about their daily struggles than the environment, it is also true that they are the most at-risk group to the adverse impacts of climate change. Quick analysis of World Bank data shows that the 60 poorest countries in the world collectively contributed 1.13% to global emissions in 2016. With high predicted rates of growth in income and population for some low- and lower-middle income countries, this percentage might increase in the future. Even so, some projections on global emissions show that even if poor countries grow at a fast rate without any considerable emission reduction policies in place, they will still contribute less than other OECD countries in 2030.
Considering optimistic pledges from the US, UK, and the EU, we extend the analysis of projections from 2030 to 2050 to determine how the contribution of developing countries to global emissions, including on a per capita basis, might change in the long term.
Methodology
Using the latest CO2 emissions data from the World Bank, we analysed countries’ emissions contributions based on income level classification. India and China have been assessed separately, as they collectively contributed more than 36% to world emissions in 2016 (see Table 1).
Table I: Countries by income level and emissions (2016)
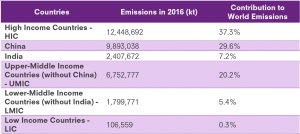
Source: Author’s calculations using World Bank data on emissions
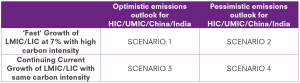
For the projections for emissions in 2050, we assessed four different scenarios, outlined in Table II below. We assessed optimistic and pessimistic emissions outcomes for high-income countries (HICs), upper-middle income countries (UMICs), India, and China—who collectively produce over 94% of the world’s emissions in 2016.
Scenarios 1 and 3 look at optimistic emissions outlooks—where these countries are likely to achieve the goals set in their individual nationally determined contribution (NDCs) and/or the Paris Climate Agreement by 2030 and 2050. Scenarios 2 and 4 assume pessimistic emissions outlooks, under which these countries are unlikely to comply with the Paris Agreement and fail to contribute to their fair share of keeping increase in world’s temperature below 2 degrees Celsius to limit irreversible impacts of climate change.[1]
We extend these scenarios with related outlooks on growth rates for low-middle income countries (LMICs) and low-income countries (LICs). Scenarios 1 and 2 assume fast economic growth of 7% for all the countries with a carbon intensity of 300 tonnes per US$1 million of GNI.[2] while Scenarios 3 and 4 assume that LMICs and LICs continue to grow at their current rate with the same carbon intensity of GNI:
Table II: Comparing possible scenarios by growth and emissions outlook
Findings
Most LMICs can contribute as much as 41% to global emissions in 2050, without any green growth strategies in place.
Among LMICs, excluding India, contributions to global emissions are expected to be considerably less than those of HICs and UMICs for 2030. However, their contributions can increase significantly by 2050 if there is no substantial ‘greening’ of their economic growth.
The worst possible global emissions outcome is Scenario 2, where most of countries fail to meet their NDCs and LMICs grow at a very fast rate with high carbon intensity. Alternatively, a more realistic scenario (Scenario 3) shows HICs, UMICs, India, and China meeting their NDCs, and LMICs and LICs growing at a constant rate. This scenario shows a decline in world emissions by 2050 despite LMICs contributing up to 41% of global emissions. Interestingly, LICs will continue to contribute less to world emissions, even at levels of economic growth with high carbon intensity (Scenario 1).
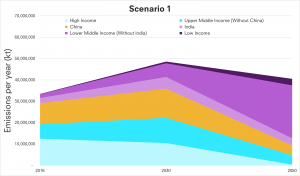
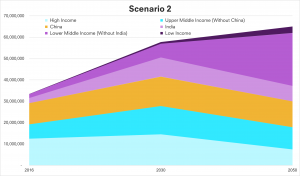
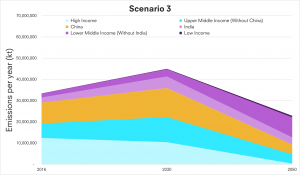
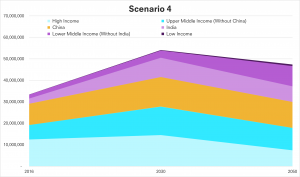
Source: Author’s calculations using World Bank data on emissions
In three of the four scenarios, LMICs (excluding India) will emit more carbon per capita by 2050 without any green growth strategies in place.
Going one step further in the analysis, we look at population trends,[3] as half of the world’s population will live in LICs and LMICs by 2050. Assessing emissions per capita allows us to understand their projected impact on global emissions relevant to their size in the long run.
As seen in the graphs below, by 2050, LMICs (excluding India) would contribute more emissions per capita than average in three out of the four scenarios in 2050 (Figures 5, 6, and 7). For LICs, the emissions per capita is considerably lower than average in all scenarios, possibly driven by a projected population increase of more than 100% from 2016 to 2050.
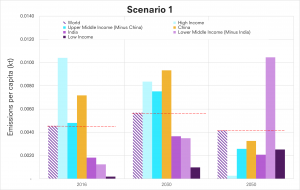
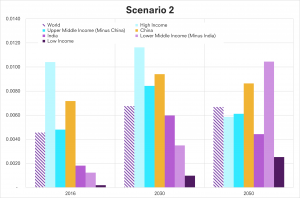
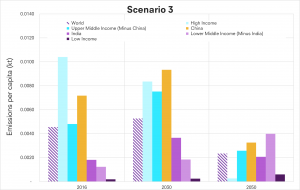
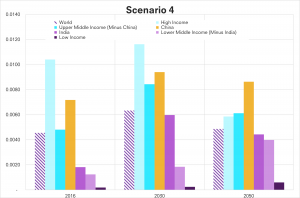
Note: The red line in each figure indicates the average emissions per capita. Each bar indicates global and country-specific income groups.
Conclusion
Our 2050 projections for emissions and emissions per capita show the danger of LMICs continuing on their growth path without any reduction in carbon intensity of this growth. It also highlights the importance of decoupling economic development and carbon emissions particularly at medium to high levels of GNI.
The Paris Climate Agreement and the resulting NDCs have been constructed to ensure national flexibility and equity in terms of emissions’ contributions—allowing for developing world to emit more carbon emissions in the early stages of development. However faster growing countries, particularly LMICs, need to start implementing policies that ensure economic growth and are also less carbon intensive. Notably, country-wise analysis shows that, within LMICs, around 40% of the emissions come from four large countries: Pakistan, Nigeria, the Philippines, and Egypt. As these countries look to grow in next 30 years, it is very important to focus on mitigation strategies that do not come at the cost of economic downturn.
LICs, with extremely high rates of poverty, contribute little to global emissions. Perhaps it is essential to prioritise economic growth that helps make the poor more resilient to the inevitable detrimental effects of climate change, especially given their high vulnerability to climate change. As all measures of growth will not lead to similar degrees of poverty reduction, pro-poor growth will have to be prioritised in some cases. For poor countries where green growth strategies are being employed for economy-wide transformations, trade-offs should be explicitly addressed and complementary policies should be in place to address the social cost of green growth.
This blog is part of IGC’s sustainable growth series.
[1] Climate Action Tracker (CAT) looks at the commitment made by each country on reducing emissions and defines a fair share range for each country based on increase in the world’s temperature. The lower end of fair share means that countries are compatible with the Paris Agreement and will be able to contribute to keep change in world’s temperature below 1.5C. The upper end means that a country’s climate policies are bordering on insufficient and highly insufficient. For this analysis, the upper end of fair share has been taken as the pessimistic outlook.
[2] UMIC with an average growth rate of 7% (24 countries ranging from 5 to 10% growth rate) had similar carbon intensity of GNI in 2016.
[3] World Population Prospects 2019