The value of democracy in the world's poorest region: Evidence from Kenya's road building
Just how significant is ethnic favouritism in Africa? It’s a common aspect of Africa’s perception and many of the continents ills have been blamed on it. Yet, it has been quite difficult to find concrete evidence of this behaviour. So how much does it actually exist and what are the effects? We look at the case of Kenya and find strong empirical evidence of ethnic favouritism but, during periods of democracy, our measures of favouritism disappear entirely. Africa’s recent improved economic performance may be due, then, to democracy placing greater constraints on the executive which in turn limits ethnic favouritism.
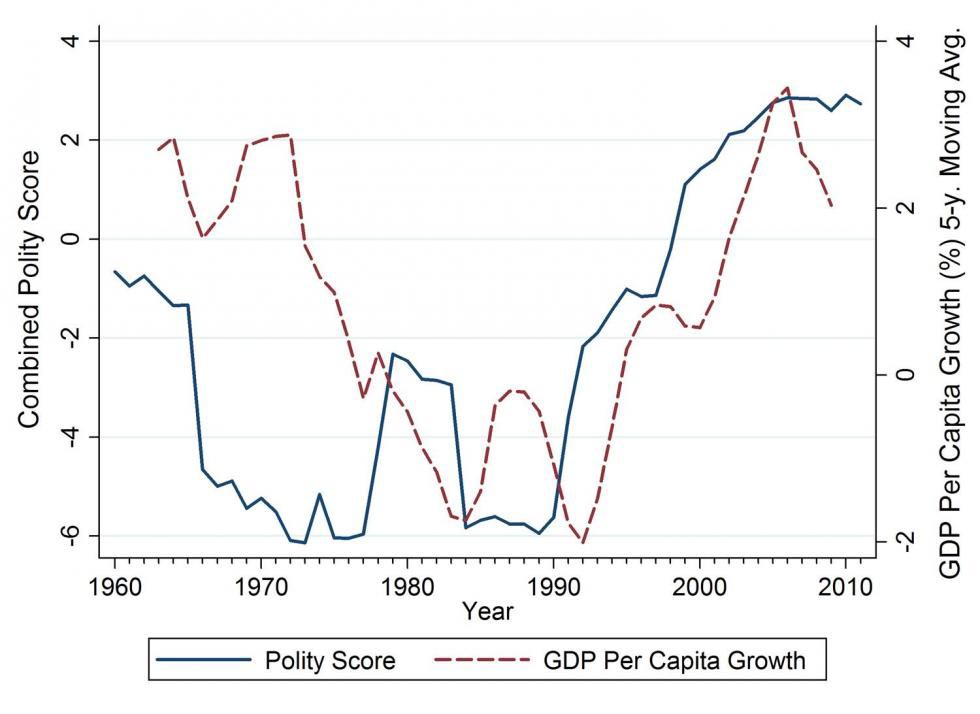
Africa’s growth tragedy has been linked to a very diverse set of factors; ethnic favouritism – a situation where coethnics receive a disproportionate share of public resources via patronage and public policy decisions when members of their ethnic group control the government purse – has been one factor argued by historians, political scientists and economists. Easterly and Levine (1997) attribute much of the poor economic performance in Africa up to the end of the 1980s as due to political frictions and economic mismanagement associated with ethnic fractionalisation. Several accounts (e.g. Bates 1983, Horowitz 1985, Esman 1994, Mamdani 1996) argue that ethnic favouritism ultimately emerges because weak political institutions are unable to constrain governments from discriminating among citizens. Therefore, to understand the recent political and economic performance of many African countries (growth rate per capita has been positive since the 1990s, after nearly three decades of negative growth, see Fig 1), we have an opportunity to determine to whether ethnic favouritism’s prevalence, and whether the emergence (or in many cases, re-emergence) of democracy has helped mitigate it.
Africa is indeed becoming more democratic (see Fig 1).[1] Between the early 1960s, when many African countries gained independence from their colonial ruler, and the end of the Cold War in 1991, not a single African ruler was peacefully succeeded at the ballot box, except in Mauritius. But since Benin’s Mathieu Kérékou and Zambia’s Kenneth Kaunda bequeathed power graciously in 1991, more than 30 African leaders or ruling parties have let their voters decide. Multiparty systems in Africa now far outnumber single-party ones. This contrasts strikingly with the Arab world, where so far almost no incumbent-ejecting elections have taken place anywhere.
FIGURE.1
In a recent paper (Burgess, Jedwab, Miguel, Morjaria and Padro i Miquel (2013)), we revisit history and try to credibly quantify the extent of ethnic favouritism in Kenya’s public expenditure, for the post-independence period and we also examine whether the transition into and out of a multiparty democracy affects ethnic favouritism.
In Kenya, a particular group due to colonial era border delineation dominates most districts and the geographic pattern on ethnic demographics has remained stable over time. This means we can assess directly, using road outcomes by district, whether or not ethnic groups that shared the ethnicity of the president benefitted disproportionately from roads. The benefit of this is that road expenditure and road construction data can be directly measured over long periods of time, as we did for all 41 Kenyan districts from independence to 2011. Not only is road expenditure the largest single element of public expenditure (15% -- three times expenditure on health, education or water) but it is centrally allocated and is a highly visible form of public investment and hence a prime target for ethnic favouritism.
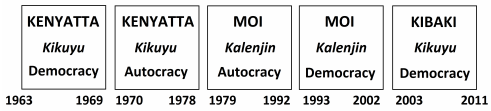
Kenya’s political history provides us with an ideal laboratory to investigate political institutional changes within a leadership. Switches in the ethnicity of the president, and switches into and out of multiparty democracy under the same president are illustrated in Figure 2:
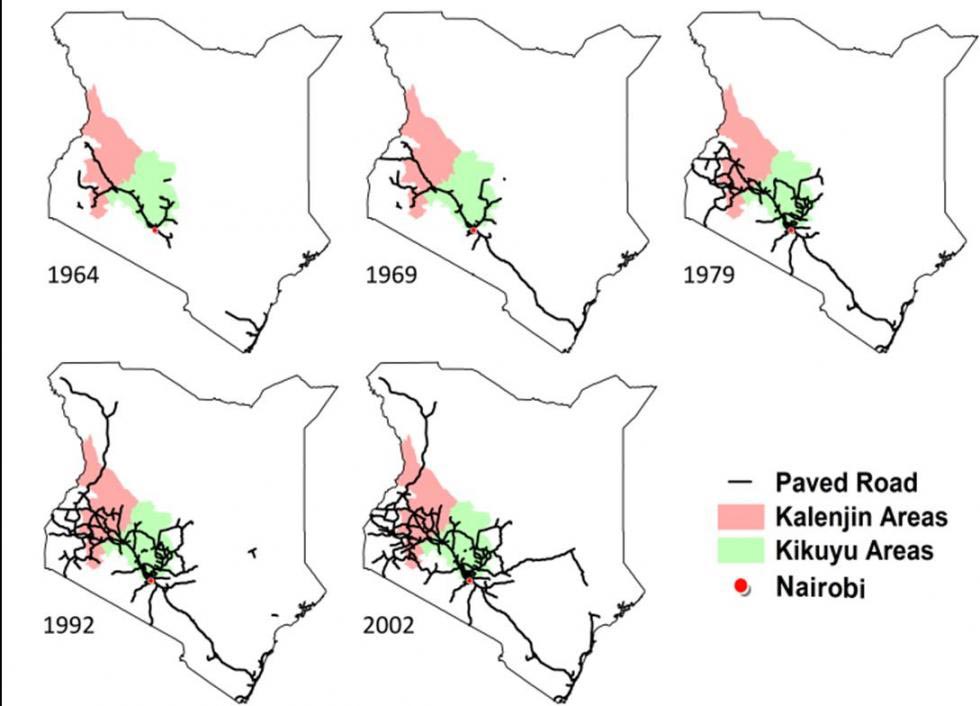
Looking at Figure 3, our results can be illustrated across key years in Kenya’s political history. The pink area represents the six Kalenjin dominant districts (11% national population), while the green area represents seven Kikuyu dominant districts (20% national population). Comparison of the road maps for 1979 and 1992 gives a first visual indication of ethnic favouritism. The paved road network in and around the green Kikuyu districts appears largely frozen between these two years. In contrast the paved road network in and around the pink Kalenjin areas expands dramatically. After 1992, in conversely, the expansion in and around the green and pink areas is much more equal.
Figure 3
By looking at whether a district receives road spending that is exactly proportional to its population, we can calculate a measure of favouritism. Taking those districts with evidence of favouritism, we can see if the majority of the people in that district share the same ethnicity of the president.
If you look in figure 4a, the grey, straight line represents what an exactly population proportional allocation of resources should yield, but clearly ethnic groups with a majority having the same ethnicity of the president (the red line) receive a larger share of road funding than those districts of a majority with a different ethnicity to that of the president (the blue line). What is really striking is that during multiparty democracy (1960s, 1990s and 2000s) the ratio is consistently lower and tends to be near one on average for both types of districts, implying little ethnic favouritism. Note that this pattern is observed within leadership.
Figure 4a
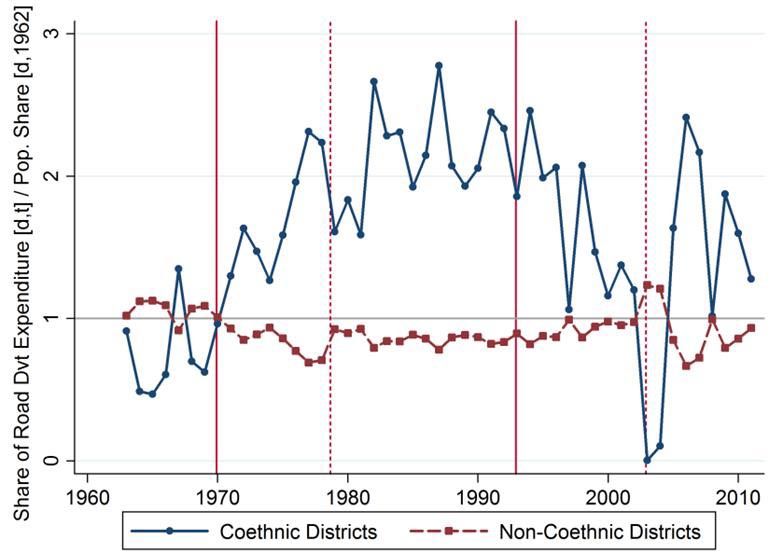
Figure 4b repeats the above exercise, but this time further disaggregates the coethnic districts into Kikuyu and Kalenjn districts includes to display that our results are not driven by a particular ethnic group in power.
Figure 4b
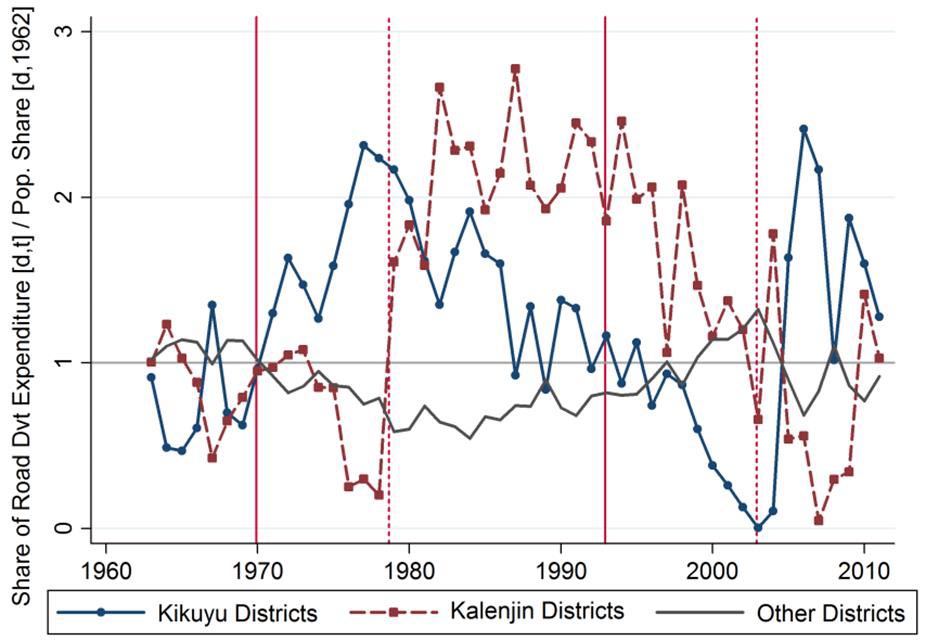
The results are telling – Kikuyu districts receive road spending in line with their population share during the democratic years. Following the banning of opposition political parties in 1969, road spending concentrates in these districts and rises to twice their population share until the death of Kenyatta (1978). After which we see a meteoric rise in Kalenjin districts allocation, and at the same time a decline in Kikuyu districts’ allocation. Kalenjin districts continue to obtain above their population’s share until the re-introduction of multiparty democracy (1992). After which we see a diminished effect on coethnic districts but a revival of the other districts – in fact, for the other districts, those that never had a coethnic president we observe a U-shaped pattern in their allocation. Democracy seems to have a levelling influence in ensuring that Kenyan districts receive roads resources roughly in line with their population share irrespective of their ethnic alignment with the president. The stark pattern in the road investments we observe in presidential coethnic districts as Kenya enters and exits autocracy is extremely difficult to reconcile with spending being driven by economic efficiency.
Across the 1963 to 2011 period, Kenyan districts that share the ethnicity of the president received twice as much expenditure on roads. This is unequivocal evidence of an extreme degree of ethnic favouritism. However, these biases are not constant. While in periods of autocracy, coethnic districts receive three times the average expenditure in roads and five times the length of paved roads, both these biases disappear entirely during periods of democracy. The political regime, then, is an important determinant of ethnic favouritism.
As Kenya’s history shows us, multiparty democracy (which re-emerged in the 1990s) changed the nature of constraints on leaders and altered the allocation of public resources. The increase in mass political participation under democracy meant citizens were better able to express themselves and allowed for far greater scrutiny of executive authorities – this could potentially explain why ethnic favouritism reduced during periods of multiparty democracy. Despite slow progress Africa is becoming more democratic, with almost all countries now holding proper elections, growth should benefit from greater public scrutiny but, ultimately, it will be up to Africans to demand representative governments, a challenge given half its population is on $1.25 per day.
References
Easterly and Levine (1997) Africa’s Growth Tragedy: Policies and Ethnic Divisions. The Quarterly Journal of Economics, 112 (4) 1203-1250.
Burgess, Jedwab, Miguel, Morjaria and Padro I Miquel (2013) The Value of Democracy: Evidence from Road Building in Kenya, Manuscript, LSE.
Bates, R. H. (1983) Modernization, Ethnic Competition, and he Rationality of Politics in Contemporary Africa. In State versus Ethnic Claims: African Policy Dilemmas, ed. Donald Rothchild and Victor A. Olunsorola. Boulder, CO: Westview Press.
Horowitz, D. L. (1985) Ethnic Groups in Conflict. Berkley: University of California Press.
Esman, M. (1994) Ethnic Politics. Cornell University Press.
Mamdani, M. (1996) Citizen and Subject: Contemporary Africa and Legacy of Late Colonialism. Princeton University Press.
Footnotes
[1] Democracy is measured by the Polity IV measure compiled by political scientist at University of Maryland. Polity IV defines three regime categories: autocracies (-10 to -6), anocracies (-5 to +5) and democracies (+6 to +10). See http://www.systemicpeace.org/polity/polity4.htm