
What’s the marginal productivity of a nurse?
Imagine you are running a national health system in a country in Africa. You run thousands of health facilities and employ tens of thousands of nurses, doctors, midwives, and other health workers. Where should you deploy these personnel to have the greatest impact on public health? Suppose there is a rural health clinic that employs two nurses. What would improve service delivery more: Posting another nurse to this clinic or simply sending more funds to the clinic?
Questions like these are fundamental for health systems and health administrators. They are also deceptively simple questions. They are simple, because the answer is obvious (to an economist, at least): Resources should be deployed to the facility where they can make the greatest marginal contribution to quality health service delivery. But they are deceptive, because measuring this marginal contribution requires careful analysis, difficult judgments about how to measure health system performance, and a lot of data.
The study: Resource allocation and health facility service delivery in Ghana
Since 2018, we – doctors and administrators from the Ghana Health Service (GHS), and academics from the University of Oxford – have been working together to answer this question for Ghana. To do so, we are using Ghana’s District Health Information Management System II (DHIMS II), a database of health service delivery in all health facilities nationwide.
The data in DHIMS II is rich: It contains hundreds of indicators of service delivery for all facilities nationwide, every month, for the past several years, all collected and validated by the GHS. It also contains information on the number of health personnel posted to each facility, and their revenues and expenditures.
We use this data to construct measures of the quantity and quality of health service delivery at each facility nationwide. We can then see how these measures change when the personnel and funds available to each facility change. Effectively, we are using the DHIMS II data to see what happens to health service delivery when a health facility goes from having one nurse to two nurses, or two nurses to three nurses, or two nurses to two nurses and a midwife – and so on.
The findings: Number of nurses and quantity and quality of healthcare
The figure below shows the average number of outpatient visits for each number of community nurses in rural outreach facilities. If each additional nurse were attracting the same number of patients to the facility, we would expect to see a straight line increasing from facilities with the lowest number of nurses, to facilities with the highest number of nurses.
However, we do not see such line, which implies that most of the gain in quantity of care stems from the first three nurses in an outreach facility. There are lots of caveats to this analysis and this relationship is not necessarily causal, but it illustrates the type of questions that this data can address.
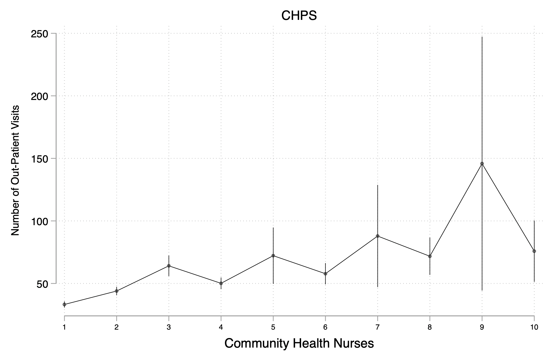
Figure 1: Community nurses and outpatient visits in 2018
Implications: Global application and policymaking
This approach to using administrative data to conduct evidence-based analysis of staff productivity and allocation is the first of its kind for a public sector agency, at least as far as we are aware. Once we’ve finished developing the method, our hope is that it might be useful for health system administrators in other countries, both within Africa and elsewhere. This approach might also be applied to other types of government services, such as teachers, tax collectors, and any other workers involved in service delivery.
A major reason why this kind of analysis hasn’t been widely conducted before is the lack of suitable data. However, more and more governments now have the necessary administrative data systems in place. Others might be in the process of developing these systems: If they are aware of the type of analysis that can be done, they can design their systems to facilitate it.
For instance, one challenge we have confronted in analysis is that GHS’s human resources data systems are different from its financial data systems and from the DHIMS II service delivery indicators, because they were each designed for their own monitoring purposes – without thinking about how they could be used together. We’re finding ways to address these issues. Countries that are in the process of designing these systems can build in these linkages from the start.
Once we have the results of our analysis, GHS will be able to feed them directly into the policymaking and personnel allocation processes since GHS officials are part of the research team. We hope that our work together can inspire similar collaborations in other government institutions around the world.
Editor's note: A policy brief from this project can also be found here.