Why food inflation has been high in India
Rising food prices have been a major concern in India, with food inflation averaging 10% between April 2007 and December 2013. It peaked at over 20% in late 2009, and was rarely at comfortable levels during this period. This was a decisive shift as the food inflation over the previous five years had averaged only 3.6%. With 22% of the population living below the poverty line in 2009-10, the persistence of food inflation at high levels is extremely undesirable. This section already spends a significant proportion of their income on food and is unable to divert additional expenditure to food to neutralise the effect of food inflation. Thus, high food inflation aggravates nutrition deficiency, which is already at a very high level in India.
In a forthcoming paper (Bhattacharya, Rao and Sen Gupta 2014), we identify the major drivers of food inflation in India and evaluate the extent to which food inflation has had an impact on non-food and aggregate inflation.
Rising international prices
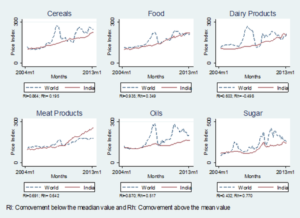
The role of international prices in fostering high inflation becomes pertinent in the backdrop of significant increase in global food prices in 2008 and 2010. Monthly data for various food products over the period 2004 to 2012 shows mixed evidence of co-movement1 between domestic and international food prices, with a great deal of variation at the commodity-level (Figure 1). The degree of co-movement is lower for staples like cereals and dairy products, and higher for tradables like edible oils, sugar and meat.
Figure 1. Co-movement between global and domestic prices
Interestingly, for all commodities, barring sugar, the degree of co-movement is higher when international prices are low (below the median value ) compared to when they are high (above the median value2). This could be an outcome of the agriculture trade policy adopted by India. India has followed a cautious approach towards agricultural trade permitting exports only after ensuring that they would not have adverse impact on domestic prices. Furthermore, it has not refrained from discretionary use of multiple instruments like export bans, import duties and other import restrictions to weaken the linkage between domestic and international prices.
Diversification of diet towards high value food products
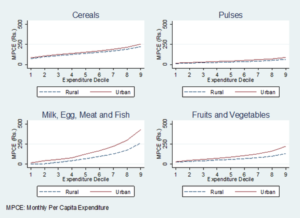
Rising per capita income and diversification of diet towards high-value food products like milk, eggs, meat, fish, pulses, vegetables and fruits, have been often cited as the reason for increased demand for these commodities. Monthly inflation in these items generally exceeded overall food inflation during 2008 and 2013. The rise in monthly per capita expenditure (MPCE), between 1987-88 and 2009-10, was associated with share of expenditure on food declining from 64% to 53.6% in rural areas, and from 56.4% to 40.7% in urban areas. At the same time starchy staples in the food basket were displaced by protein-rich foods. Per capita annual consumption of cereals and pulses dropped in both urban and rural areas between 2004-05 and 2009-10 while consumption of milk, eggs and chicken meat witnessed a significant increase. On average, a household belonging to the top three deciles3 consumes marginally more cereals compared to a household belonging to the bottom three deciles. In sharp contrast, in case of protein-rich items such as milk, meat and fish, the ratio of consumption by the top three deciles to the bottom three deciles increases to 4.4, while in case of fruits and vegetables, the ratio is 3.4, implying that as households' income improves, their expenditure on food shifts towards proteins, fruits and vegetables (Figure 2).
Figure 2. Food consumption across expenditure deciles
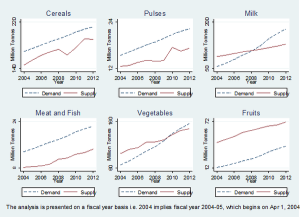
With clear evidence of a dietary shift towards products contributing significantly to the food inflation in recent years, we estimate the change in aggregate household demand for various food products resulting from this shift in diet, by calculating the expenditure elasticity of major food products using household survey data from National Sample Survey Organisation (NSSO). These elasticities are all positive, with expenditure elasticities for milk and milk products, vegetables and fruits being over one, suggesting that a 1% increase in household expenditure on food is associated with a more than 1% increase in the demand for these items. Elasticity for meat and fish, although below one, is high enough to cause significant rise in demand for these items as total expenditure on food increases. We estimate the overall aggregate demand by incorporating the indirect demand for seed feed and wastage, while supply is based on annual production adjusted for post-harvest wastage.
Figure 3. Estimated demand and supply gap for major food items
For cereals and pulses, during the period 2004-05 to 2012-13, supply has persistently lagged demand, with the gap widening in drought years (Figure 3). Similarly, in the case of meat and fish, supply has not kept pace with demand, and the gap has widened in recent years. High expenditure elasticity of demand for vegetables and milk has meant that the situation of excess supply that existed in the initial years transformed into a situation of excess demand in recent years. It is only in case of fruits that total supply is in excess of estimated demand. Thus, shift in demand towards high value food items in the face of rising household income partly explains the recent inflationary pressure on these commodities.
Rising input costs
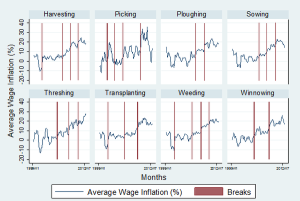
Cost of agriculture labour, which accounts for more than 40% of total cultivation cost for major food products, has witnessed significant increase in recent years. Until 2007, agriculture wages grew in line with inflation, but since then agricultural wage growth has far outpaced inflation. We identify several structural breaks (unexpected shifts) in wage inflation, for the various agriculture occupations during the period 1999 to 2012. In case of all activities, the average wage inflation rate entered double digits around 2007-08, and was close to, or exceeded 20% in the period after 2010 (Figure 4). There is also evidence of strong impact of wage inflation on food inflation with a 10% rise in wage inflation leading to 2.3% rise in food inflation. At the same time, a 10% rise in food inflation results in a 3.8% increase in wage inflation, thereby implying the existence of a strong wage price spiral in the agriculture sector.
Figure 4. Agriculture wage inflation
A plausible reason for the rise in rural wages is the Mahatma Gandhi National Rural Employment Guarantee Act (MNREGA) which, by providing 100 days/ year of wage employment to a rural household, could have tightened the availability of agricultural labour during peak seasons, resulting in wage pressure and keeping food price in?ation high even in years of good production. The indexation of wage rate under this programme to Consumer Price Index (CPI) since 2011 has also pushed up the minimum wage.
The price of fuel, another key input in agriculture used to transport the produce as well to power key agriculture machines, has witnessed considerable increase in recent years. We again find evidence of substantial pass through from fuel inflation to food inflation. An increase in fuel inflation by 1% leads to a 0.13% rise in food inflation, and the effect slowly declines through the next 12 months. Furthermore, five months after a shock to food inflation, 3.4% variation in food inflation is due to variation in fuel inflation, and this increases to 3.9% after 10 months.
High minimum support prices
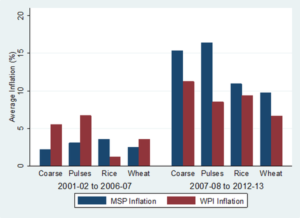
Since 2007-08, the hikes in minimum support prices (MSP) have been significantly higher compared to the period 2001-02 and 2006-07. Not surprisingly, the latter period witnessed much higher rates of Wholesale Price Index (WPI) inflation for these food products. The commodities on which MSPs are announced comprise more than 30% of the WPI food basket. The MSPs form a floor price4 for various crops, and if the floor price keeps rising, as has been the case in India, it leads to a rise in wholesale prices as well. This has indeed been the case for most crops in India (Figure 5). The high MSPs have also translated to massive procurement by the government with the current stocks held with the Food Corporation of India far exceeding the buffer stock norms. However, it is evident that not enough open market sales were resorted to reign in spike in prices due to demand and supply imbalances.
Figure 5. MSP and WPI inflation
Transmission to non-food and aggregate inflation
In the backdrop of persisting high food inflation in India, we gauge the transmission of food inflation to core (non-food non-fuel) inflation and headline inflation. Food inflation may have positive impact on core inflation via rise in cost of labour inputs, substitution effects of higher relative food prices as well as the real income effect of producers in the food sector. Rise in food inflation will induce labourers to bargain for higher wages, if food constitutes a significant part of their consumption basket. This would raise the cost of production and hence prices of non-food items as well. Rise in food prices relative to aggregate prices would raise demand for non-food products via substitution effect and also via income effect of the producers in the food sector, as their real income increases with rise in relative price of food.
Figure 6. Transmission of food to core and aggregate CPI inflation
(a) Response of Core to Food (b) Response of Aggregate CPI to Food
An increase in food inflation causes aggregate CPI inflation to rise substantially as food constitutes a large share of the CPI basket. Apart from this direct effect, aggregate inflation increases indirectly due to rise in core inflation as a result of the transmission of food inflation into it. Specifically, we find 1% increase in food inflation results in core inflation rising by 0.61% immediately, which further increases to 0.72% in the next period, and is followed by a reduction to 0.55% that persists till 20 months after the shock (Figure 6). Similarly, an increase in food inflation raises aggregate inflation by 0.65% after two months of the shock and exerts a persistent upward pressure on the aggregate inflation. Thus in either case the impact turns out to be persistent and takes a long time to die out.
Concluding remarks
Food inflation has become increasingly persistent in recent years implying any shock will have a much longer impact on inflation. Furthermore, a wide range of products have contributed to food inflation at different points in time, reflecting the diverse nature of drivers of food inflation. These have ranged from high international prices, surge in demand for high value products due to rising income and diversification of diet, high minimum support prices and increase in prices of key inputs.
This 'Ideas for India' column is available at http://ideasforindia.in/article.aspx?article_id=278.
Notes:
- Co-movement refers to the tendency of two variables (in this case, domestic and international food prices) to move parallel to each other.
- The median of a list of numbers can be found by arranging all the observations from lowest value to highest value and picking the middle one. If there is an even number of observations, then there is no single middle value; the median is then usually defined to be the average of the two middle values.
- If all households in the population are ranked in ascending order according to their consumption levels, and then the entire population is divided into 10 equal groups (each comprising approximately 10% of the total population) – the 10th decile will comprise the top 10% in terms of consumption.
- A price floor is a government- or group-imposed price control or limit on how low a price charged for a product can be.
Further Reading
Bhattacharya, Rudrani, Rao, Narhari and Sen Gupta, Abhijit (2014), ‘Understanding Food Inflation in India’, ADB South Asia, Working Paper No. 26.
- See more at: https://www.theigc.org/why-food-inflation-has-been-high-india#sthash.0s6zWgx2.dpuf"


