Do social assistance programmes reach the poor? Micro-evidence from 123 countries
This brief presents three key findings on the effectiveness of social assistance. These messages are based on analysis of a rich dataset that covers 123 developing and transitioning countries.
-
Parekh-and-Bandiera-2020-Growth-Brief.pdf
PDF document • 755.77 KB
Governments around the world rely on social assistance to reduce poverty, but the poorest are left behind.
There has been a sharp reduction in global poverty over the past 25 years, from 36% in 1990 to 10% in 2015. Yet, 736 million people continue to live on less than USD 1.90 a day (World Bank, 2015), most of them in middle-income countries. In recent years, the largest reductions in extreme poverty worldwide have resulted from substantial economic growth in many emerging economies, particularly China and India (Page and Pande, 2018).
To help fill knowledge gaps in this area, this brief presents three key findings on the effectiveness of social assistance. These messages are based on analysis of a rich World Bank dataset – ASPIRE (The Atlas of Social Protection Indicators of Resilience and Equity) – that covers 123 developing and transitioning countries.
Key message 1 – Social assistance is the main tool to reduce poverty.
There are different types of social programmes such as social protection, labour market interventions, and health and education programmes. Social assistance schemes are non-contributory interventions (i.e. the government or other providers pay the full amount of the assistance) designed to help individuals and households cope with chronic poverty, destitution, and vulnerability. Examples include unconditional and conditional cash transfers, non-contributory social pensions, food and in-kind transfers, school feeding programmes, public works, and school fee waivers.
Of the different kinds of social programmes, this brief focuses on social assistance because it:
- Lays the foundation of all social spending. Social assistance aims to reach the poorest and/or most vulnerable sections of society and provide a minimum basic standard of living.
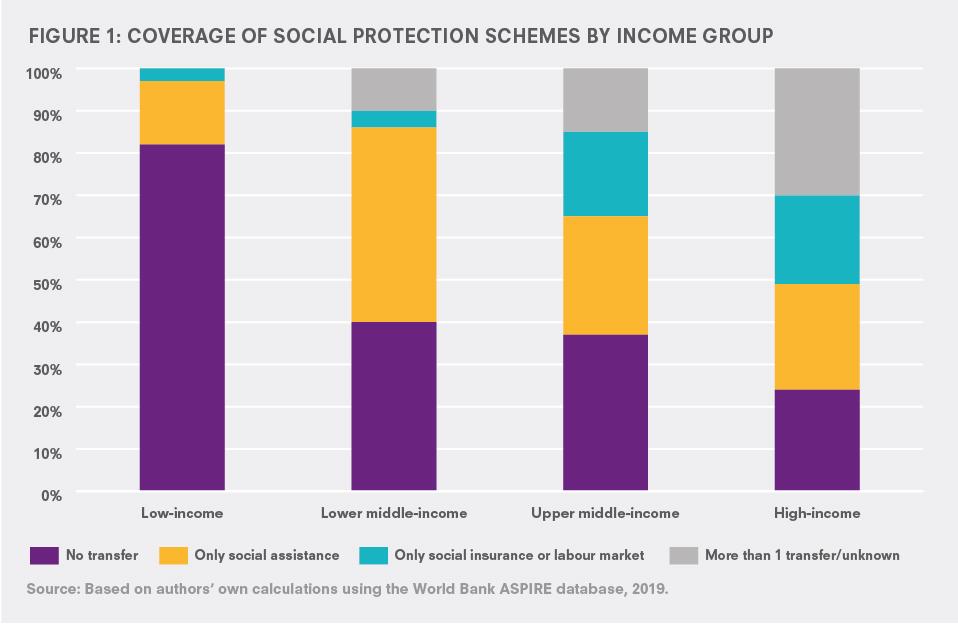
- Reaches the largest number of people. Of all the different social protection and labour schemes (social insurance, labour market interventions, and social assistance), social assistance has the highest levels of coverage. As shown in the figure below, social assistance covers 46% of the total population in lower middle-income countries and 15% in low-income countries. It also constitutes 16% of the total income of the poorest 20% of the population.
- Reduces poverty. Social assistance has made a substantial contribution to poverty reduction. In developing countries across the world, the poverty headcount ratio (i.e. the percentage of the population below the poverty line) is 7% lower and the poverty gap falls by 14% once social assistance transfers are factored in.
Of the different kinds of social assistance, unconditional cash transfers have brought the greatest number of people out of poverty (3.7%), followed by social pensions (2%), and conditional cash transfers (0.8%).
Figure 1: Coverage of social protection schemes by income group
Key message 2 – Yet, the poorest are left behind.
The decreases in poverty described in Key Message 1 are driven by high-income countries. The difference in poverty reduction between low- and high-income countries is stark. Once social assistance transfers are factored in, the poverty headcount – the total number of people living in poverty – reduced by 3% in low-income countries, as opposed to 6% in lower middle-income, 8% in upper middle-income, and 16% in high-income countries.
Further, social assistance in lower-income countries is also less cost-effective. Social assistance in low-income countries delivers approximately 14 cents in poverty gap reduction for each USD spent on social assistance programmes, as compared to 45 cents in high-income, 32 cents in upper middle-income, and 29 cents in lower middle-income countries.
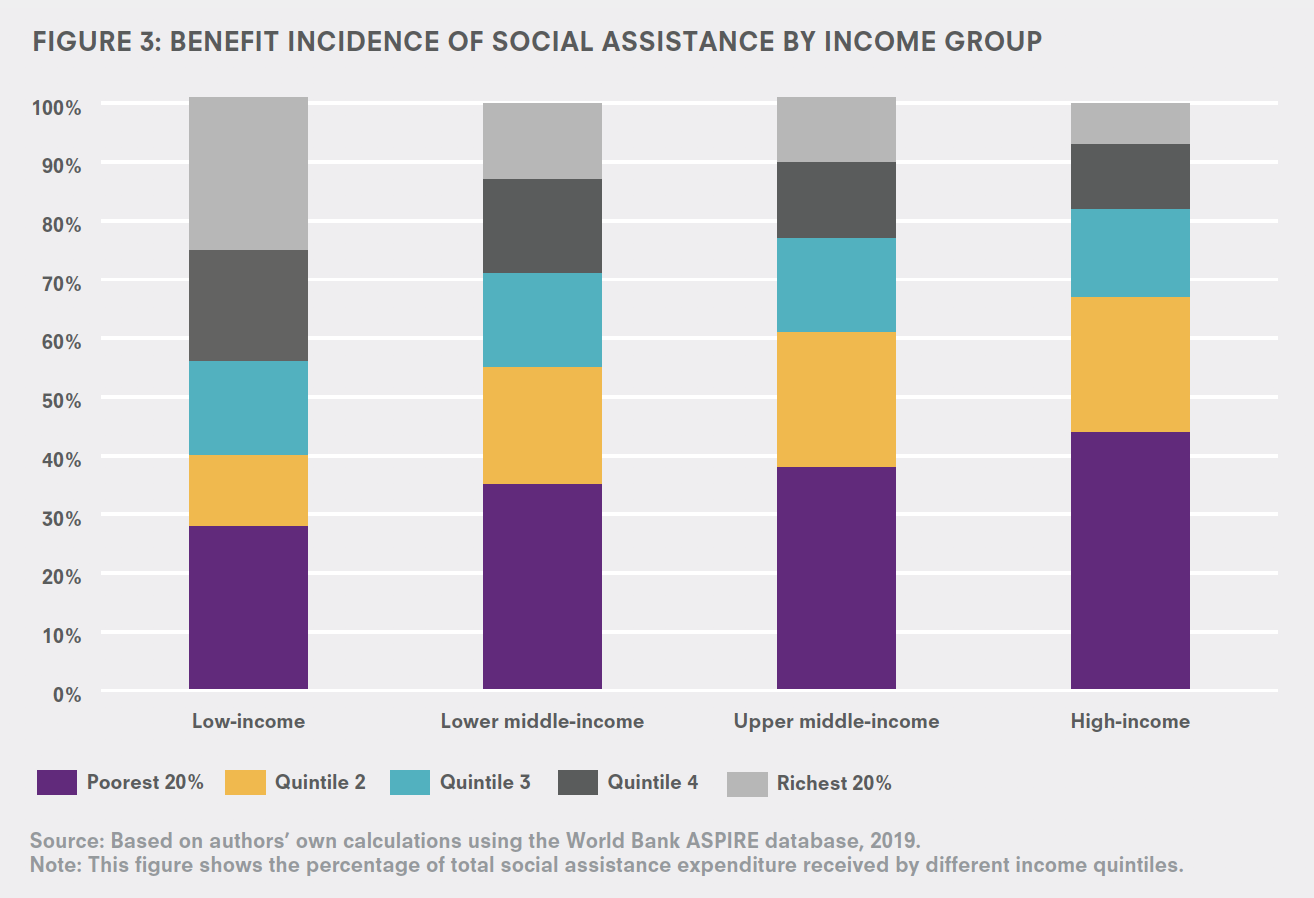
This is likely because poorer countries have been worse at targeting the poorest people, as alluded to in Ravallion (2016). As the following figures show, coverage is low in low-income countries and a large proportion of the benefits from social assistance are not received by the poorest. Figure 2 demonstrates that only 21% of the poorest receive social transfers as opposed to 73% in high-income countries. Further, figure 3 illustrates that in low-income countries, the bottom 20% receive 28% of total social assistance benefits, only slightly more than the 26% received by the richest 20%; by contrast, in high-income countries, the poorest 20% of the population receive 44% of total benefits, more than 6 times the proportion received by the richest quintile (i.e. richest 20% of the population).
Figure 2: Coverage of social assistance by income group
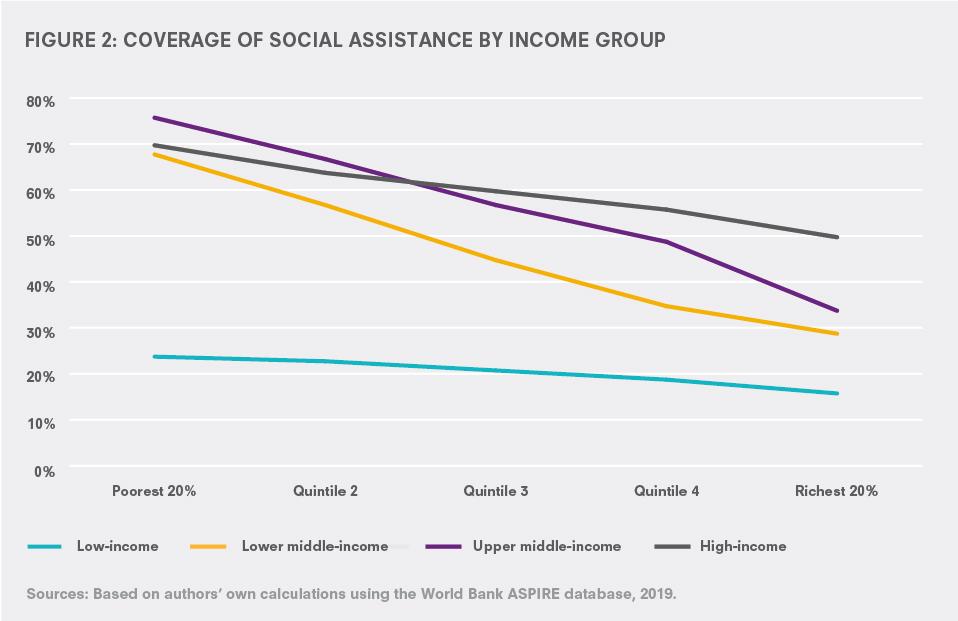
Figure 3: Benefit incidence of social assistance by income group
These findings are mirrored across different regions with less developed regions of sub- Saharan Africa and South Asia being worse at targeting. Figure 4 shows that the lowest coverage of social assistance is found in sub-Saharan Africa and South Asia (excluding India), particularly among the poorest. Only 22% and 26% of the poorest in sub-Saharan Africa and South Asia respectively, receive any social assistance. This implies that 78% of the poorest people in sub-Saharan Africa receive no social transfers from the government.
Figure 4: Coverage of social assistance schemes by region
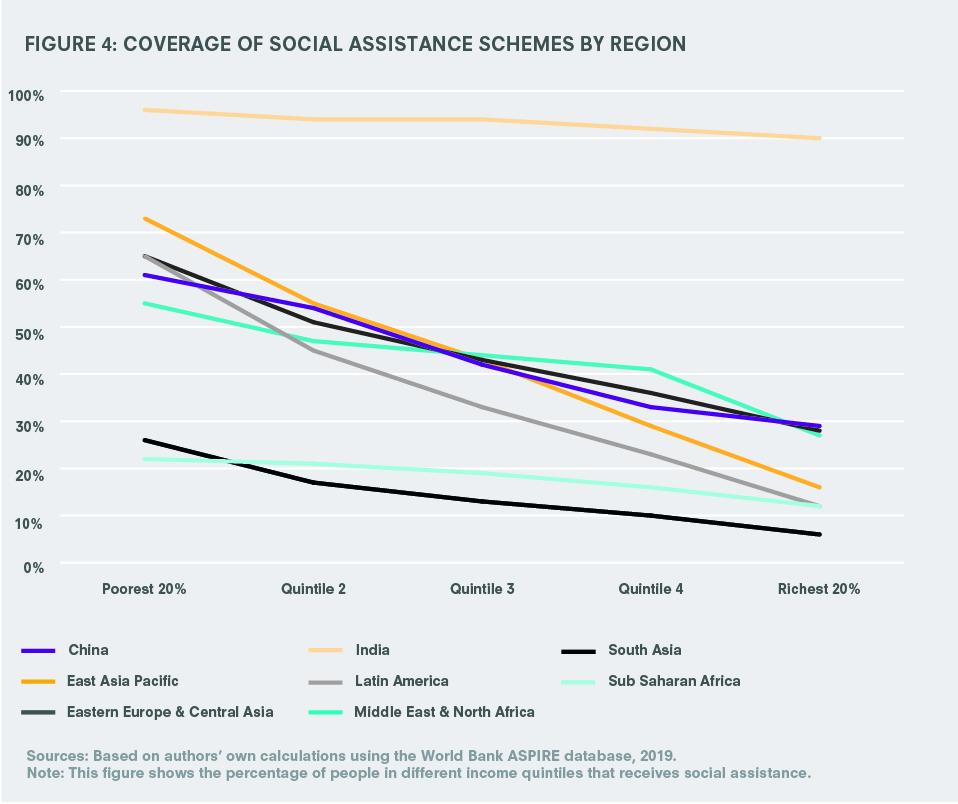
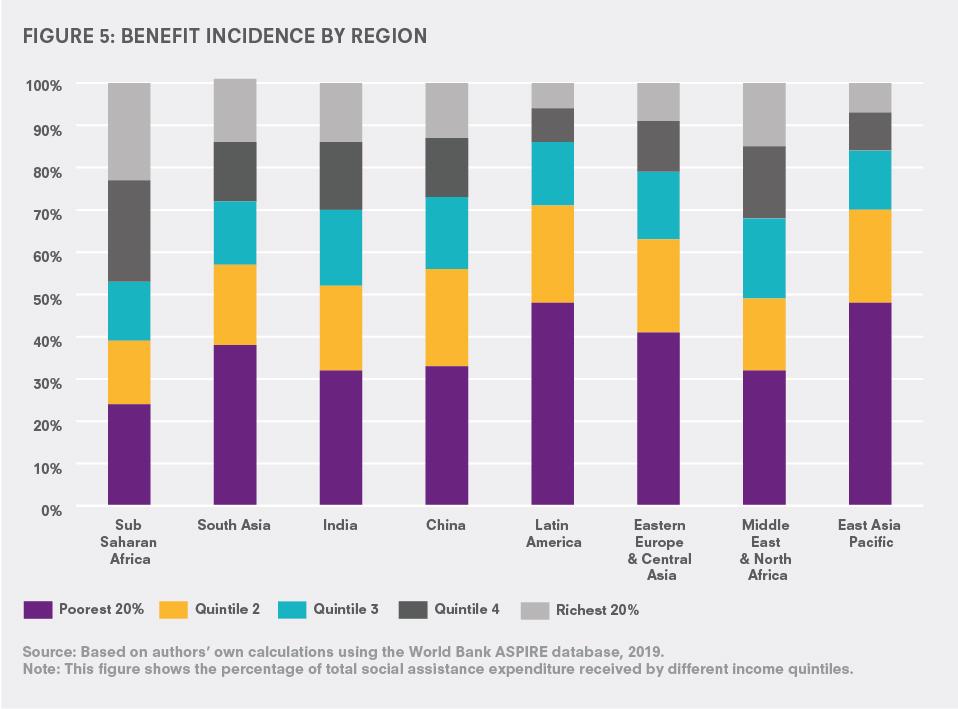
Also, the distribution of social assistance is flatter in these two regions implying that the coverage of social assistance is equal across all income levels in these regions. This is especially true in sub-Saharan Africa where, as shown in figure 5, the poorest and richest quintiles receive similar proportions of social assistance transfers. All other regions show a progressive distribution of benefits. For example, in East Asia Pacific, 48% of social assistance goes to the poorest and 7% to the richest.
Figure 5: Benefit incidence by region
Key message 3 – Failure to reach the poorest is correlated with informality and data quality.
This section analyses the correlation between mistargeting of social assistance schemes, national income, and two key determinants of state capacity: data quality and informality. Figure 6(a) below shows a clear positive relationship between GDP per capita and the proportion of total benefits received by the poorest quintile. Similarly, there is a negative relationship between the proportion of benefits received by the richest quintile and GDP per capita as shown in Figure 6(b).
Figure 6a: How does the wealth of a nation relate to social assistance targeting?
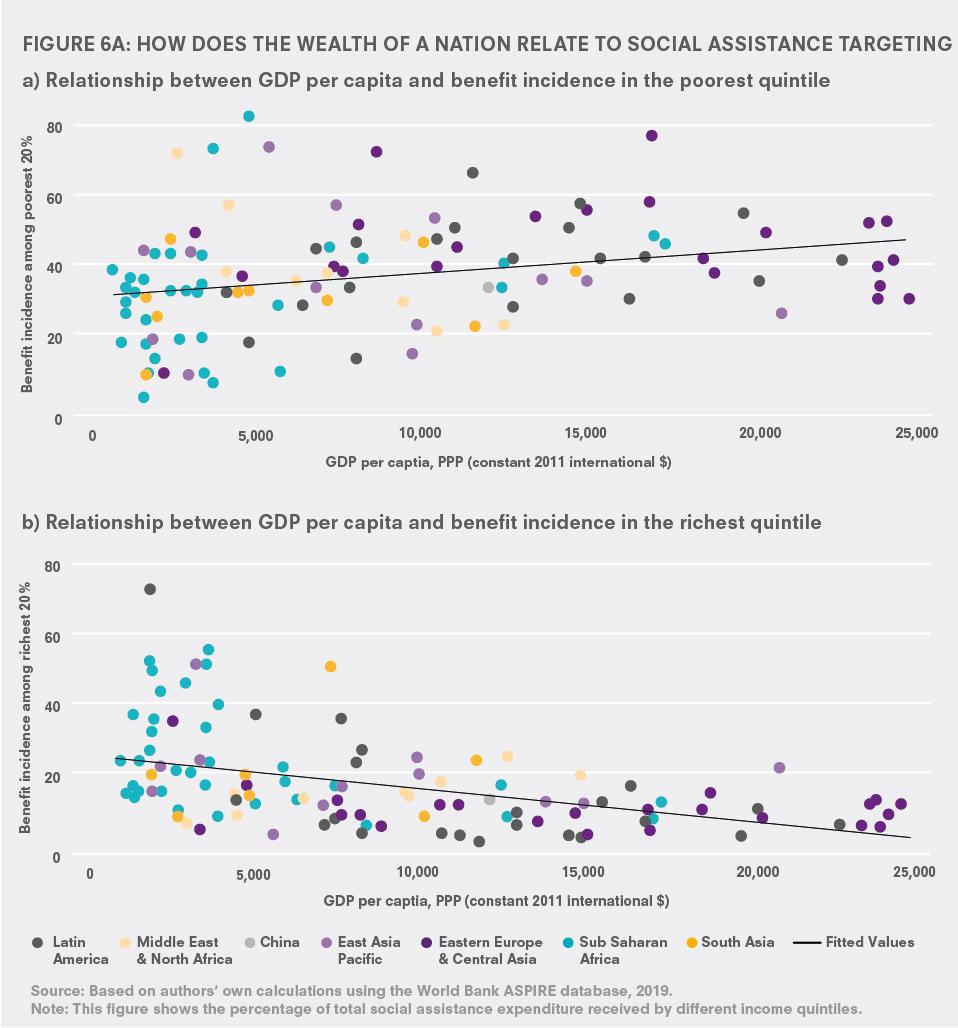
This substantiates Key Message 2 with country-level data that demonstrates that the poorest quintile in lower-income countries receive a smaller share of social assistance, and the richest quintile a larger share, than they do in wealthier countries.
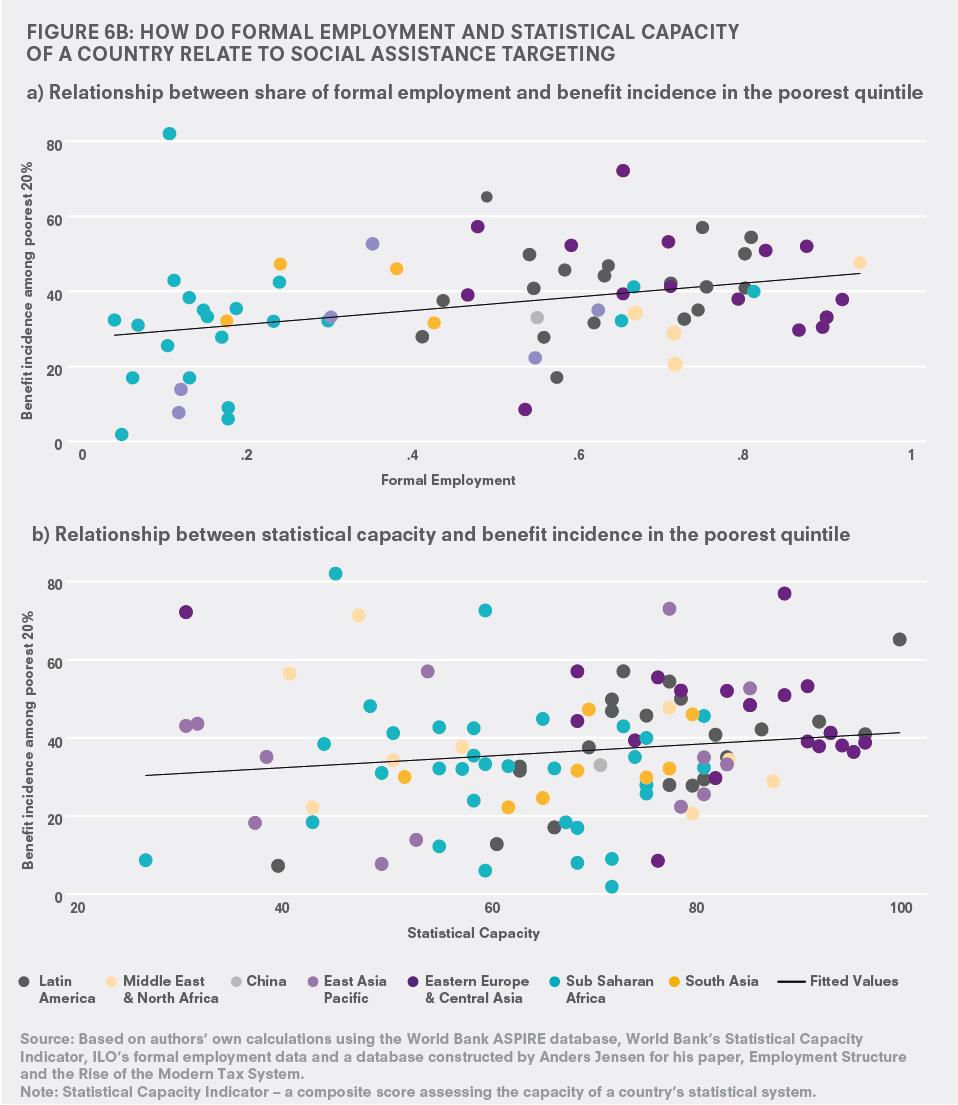
There is also a positive correlation between targeting the poor and the share of formal employment and statistical capacity in a country. Countries with greater data availability and more formality target the poor better. However, only 14% of the difference in targeting across different countries can be explained by these two factors. Further work needs to be done to understand what other factors lead to poorer countries failing to target the poorest.
Figure 6b: How do formal employment and statistical capacity of a country relate to social assistance targeting
Policy recommendations
Social assistance is a crucial component of social welfare and can help alleviate poverty and inequality. But poor people are being left behind by the current system due to lack of effective targeting by lower-income countries. To tackle this issue, we offer the following policy recommendations:
- Explore social policy designs that reduce exclusion errors, such as self-evaluation, opt-in or universal schemes. In places where cash grants are not reaching the poorest and the costs of universalisation are not feasible, self-targeting mechanisms coupled with small barriers to dissuade the rich from accessing the grant can help overcome mistargeting. For example, a study in Indonesia (Alatas et al., 2016) demonstrated that introducing a small application cost to a transfer programme substantially improved targeting through self-selection.
- Increase and improve the efficiency of funding for social assistance programmes. Apart from increasing social assistance spend, which is relatively low in developing countries (1.5% of GDP) when compared to advanced economies (15% of GDP), low-income countries should explore other implementation channels such as digital transfers to reduce administrative costs. A study in Niger (Aker et al., 2016) demonstrated that where infrastructure is available, mobile payments can reduce transaction costs and increase diet diversity making it a simple and low-cost way to deliver transfers.
- Use more data to design and implement effective policy. Different social assistance programmes have varying effects on poverty likely due to differences in targeting, coverage, and transfer amount. Governments should collate and harness data from existing programmes with effective targeting mechanisms for other schemes, and to understand the profile of the excluded population.
- In times of crisis, do not limit relief efforts to existing programmes. In situations such as during the COVID-19 pandemic, the efficacy of existing social transfers to soften the blow of economic shocks is limited in regions such as sub-Saharan Africa. Please see the IGC blog COVID-19 underscores need to overhaul social policies across Africa for COVID-19 specific recommendations based on this analysis.
References
Aker, J, K Welch and C Rowe (2016), “Payment Mechanisms and Anti-Poverty Programs: Evidence from a Mobile Money Cash Transfer Experiment in Niger”, Economic Development and Cultural Change, 65(1), pp. 1–37.
Aker, J (2017), “Comparing Cash and Voucher Transfers in a Humanitarian Context: Evidence from the Democratic Republic of Congo”, The World Bank Economic Review, 31(1), pp. 44–70.
Alatas, V, A Banerjee, H Rema, B Olken and J Tobias (2012), “Targeting the Poor: Evidence from a Field Experiment in Indonesia”, American Economic Review, 102(4), pp. 1206–40.
Jensen, A (2019), “Employment Structure and the Rise of the Modern Tax System”, Working paper.
Jones, B F and B Olken (2008), “The Anatomy of Start-Stop Growth”, Review of Economics and Statistics, 90(3), pp. 582–587.
Margitic, J and M Ravallion (2019), “Lifting the floor? Economic development, social protection and the developing World’s poorest,” Journal of Development Economics, Elsevier, vol. 139(C), pp. 97–108.
Page, L and R Pande (2018), “Ending Global Poverty: Why Money Isn’t Enough”, Journal of Economic Perspectives, 32(4), pp. 173–200.
Parekh, N (2020), “COVID-19 underscores need to overhaul social policies across Africa”, IGC Blog.
Ravallion, M (2016), “Are the world’s poorest being left behind?”, Journal of Economic Growth, 21(2), pp. 139–164.
World Bank Press Release (2019). Decline of Global Extreme Poverty Continues but Has Slowed: World Bank.
World Bank Report (2018). The State of Social Safety Nets.
CITATION:
Parekh, N and O Bandiera (2020), Do social assistance programmes reach the poor? Micro-evidence from 123 countries. IGC Growth Brief Series 023. London: International Growth Centre.


