
Roads to trade: Connecting mines versus cities in West Africa
A recent project aims to decipher what kind of transport infrastructure West African countries need most to generate economic growth. The relative gains of prioritising internal market potential (cities) versus the export of natural resources (mines to ports) are calculated through a counterfactual comparative analysis with actual road and track building that took place between 1965 and 2012.
Inter or intra connectivity?
Should African countries build more transport infrastructure to export natural resources to overseas markets, or should they focus on improving internal and regional connectivity between cities? This is an important question, with no easy answer. On the one hand, Africa has a comparative advantage in primary commodities, and the first strategy may best serve her trade. On the other hand, to improve internal connectivity is a top priority of development agencies, on the premise that more regional market integration is needed to foster sustainable growth.
The project
The aim of this project is to help to make an informed decision between these development strategies, by studying the role of natural resources in shaping the development of road infrastructure in West Africa. By investigating the impact of new mine-to-coast connections on the spatial equilibrium of the economy, and by comparing this to a benchmark “optimal” infrastructure network, we may learn lessons about what kind of transport infrastructure African countries need most.
The data
We collected data on 13 West African countries (Benin, Burkina Faso, Cote D'Ivoire, the Gambia, Ghana, Guinea, Guinea Bissau, Liberia, Mali, Niger, Senegal, Sierra Leone, Togo), on the location and size of their cities (Africapolis), the location of mines and deposits (various sources), and the location of ports (the National Geospatial-Intelligence Agency’s World Port Index). Moreover, we digitised historical Michelin road maps from 1965 onwards, which provide information on where roads were paved over time. Combined, these data points allow us to track over time which roads have been paved, but also to build counterfactual scenarios that track which roads should have been paved had the country followed specific counterfactual strategies.
Findings
a) Cities
First, the country could have maximised the country’s internal market potential, as captured by the relative size and location of cities: large cities and cities close to one another should have been connected first. Alternatively, the country could have maximised its capacity to export mineral resources: in that case, mineral deposits should have been connected to ports, with large deposits (close to the coast) being connected to deep harbours first. [1]
b) Roads
Using GIS networking techniques, similar to the technique behind routing in Google Maps, we constructed for each counterfactual scenario (market potential versus resource export) a sequence of paving along roads. The limiting factor each year is that a country has a limited budget to pave roads as is observed from the total kilometres of actual paving that occurred in a given year.
The 13 West African countries combined had 85,515 km of tracks and roads in 1965, of which 10,477 km were paved. By 2012, they had added 15,959 km of new tracks and paved 19,771 km of roads. Also, some roads deteriorated over time. See Table 1 below. These developments vary by country. Figure 1 below shows the development of the best (hard surfaced) roads over time as a share of each country’s surface area.
Table 1: West African road quality dynamics 1965-2012
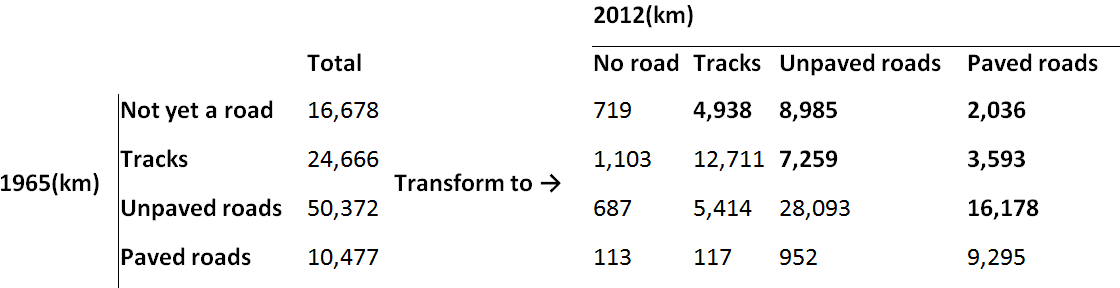
Note: If ‘not yet a road’ transform to ‘no road’ then this implies that a road to track was built in the intervening years but deteriorated over time.
Figure 1: Hard surfaced road improvement by country
![]()
The case of Cote d’Ivoire
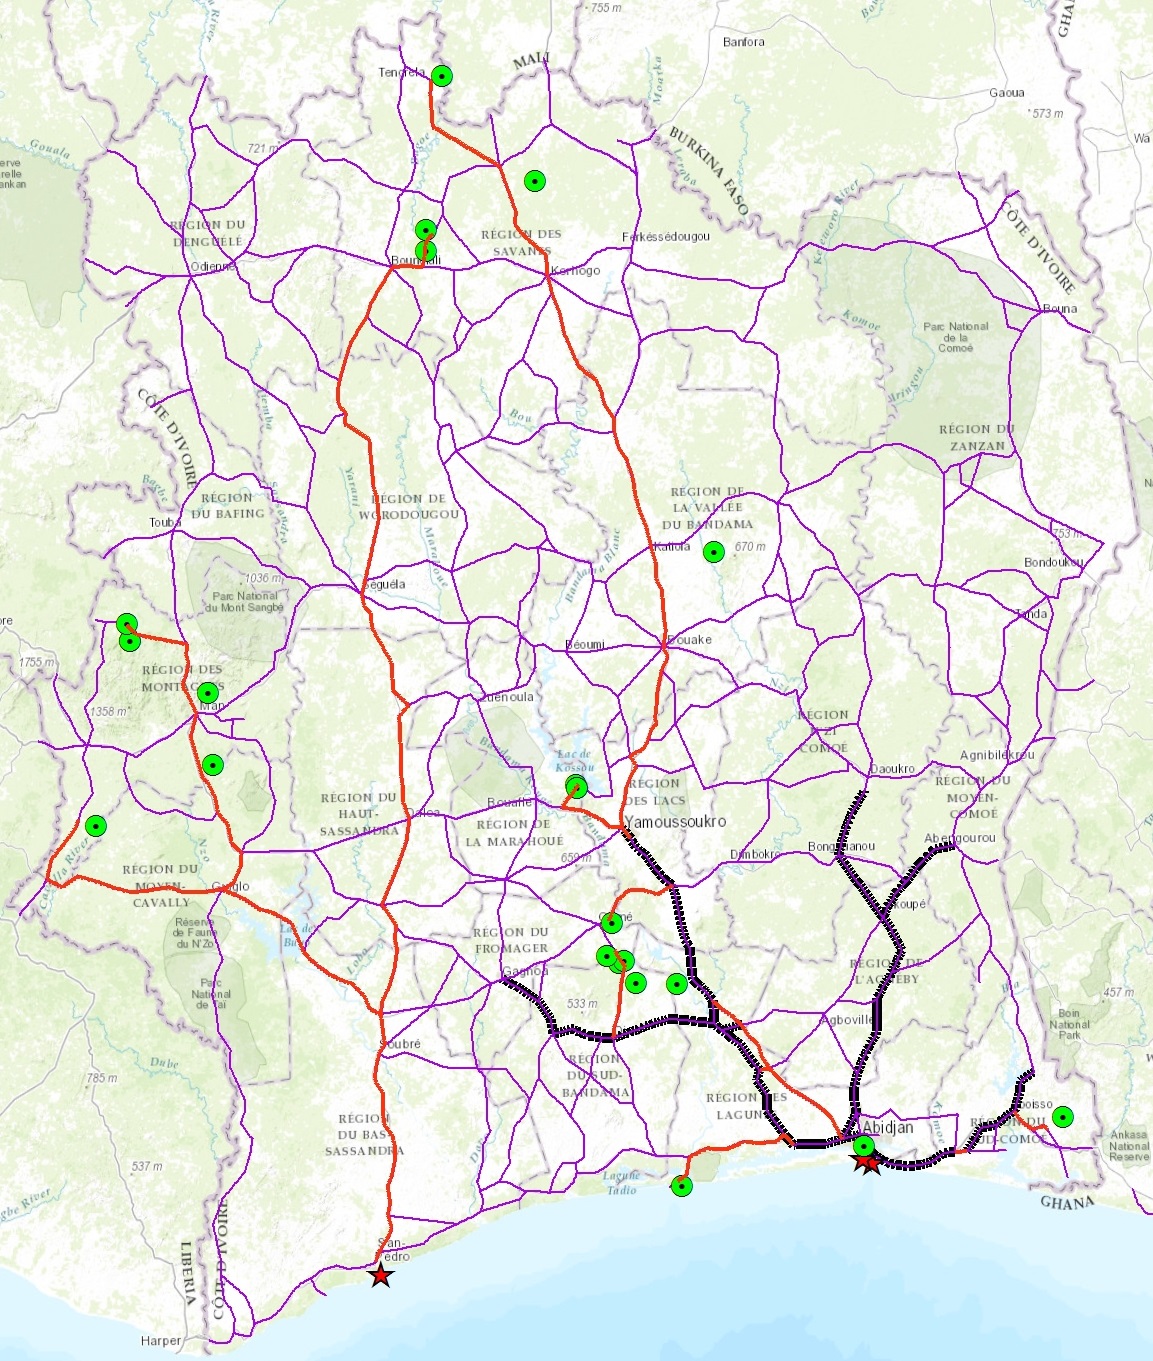
We measure the extent to which road paving in this period coincided with the market potential counterfactual versus the resource export counterfactual. Consider for example the case of Cote d’Ivoire. Figure 2 shows this country’s road network in 2012 in three scenarios. In each case, we highlight the 1965 base-year paved network of roads in black. Panel A shows the actual paved roads network by 2012, Panel B the counterfactual market potential road network, and Panel C the counterfactual resource export road network (the green circles indicate mineral deposits, while the red stars are deep-water ports). Panel A illustrates that Cote d’Ivoire placed emphasis in connecting the interior of the country to the coast. According to panel B, the country would have concentrated road investment closer to major population centres nearer to the coast if it had optimised market potential.
Between 1965 and 2012, 4417 km of roads were paved. Of these, 65% would also have been paved under the market potential counterfactual, and 41.6% would also have been paved under the resource export counterfactual. Of the 35% (100% - 65%) of roads that were paved even though they did not maximise market potential, 23% overlap with the mining counterfactual and may thus be attributed to mining. A similar analysis can be extended to the other 12 countries in our sample, and to each of the 18 sub-periods for which we have data on road paving.
Figure 2: Road paving in Côte d’Ivoire
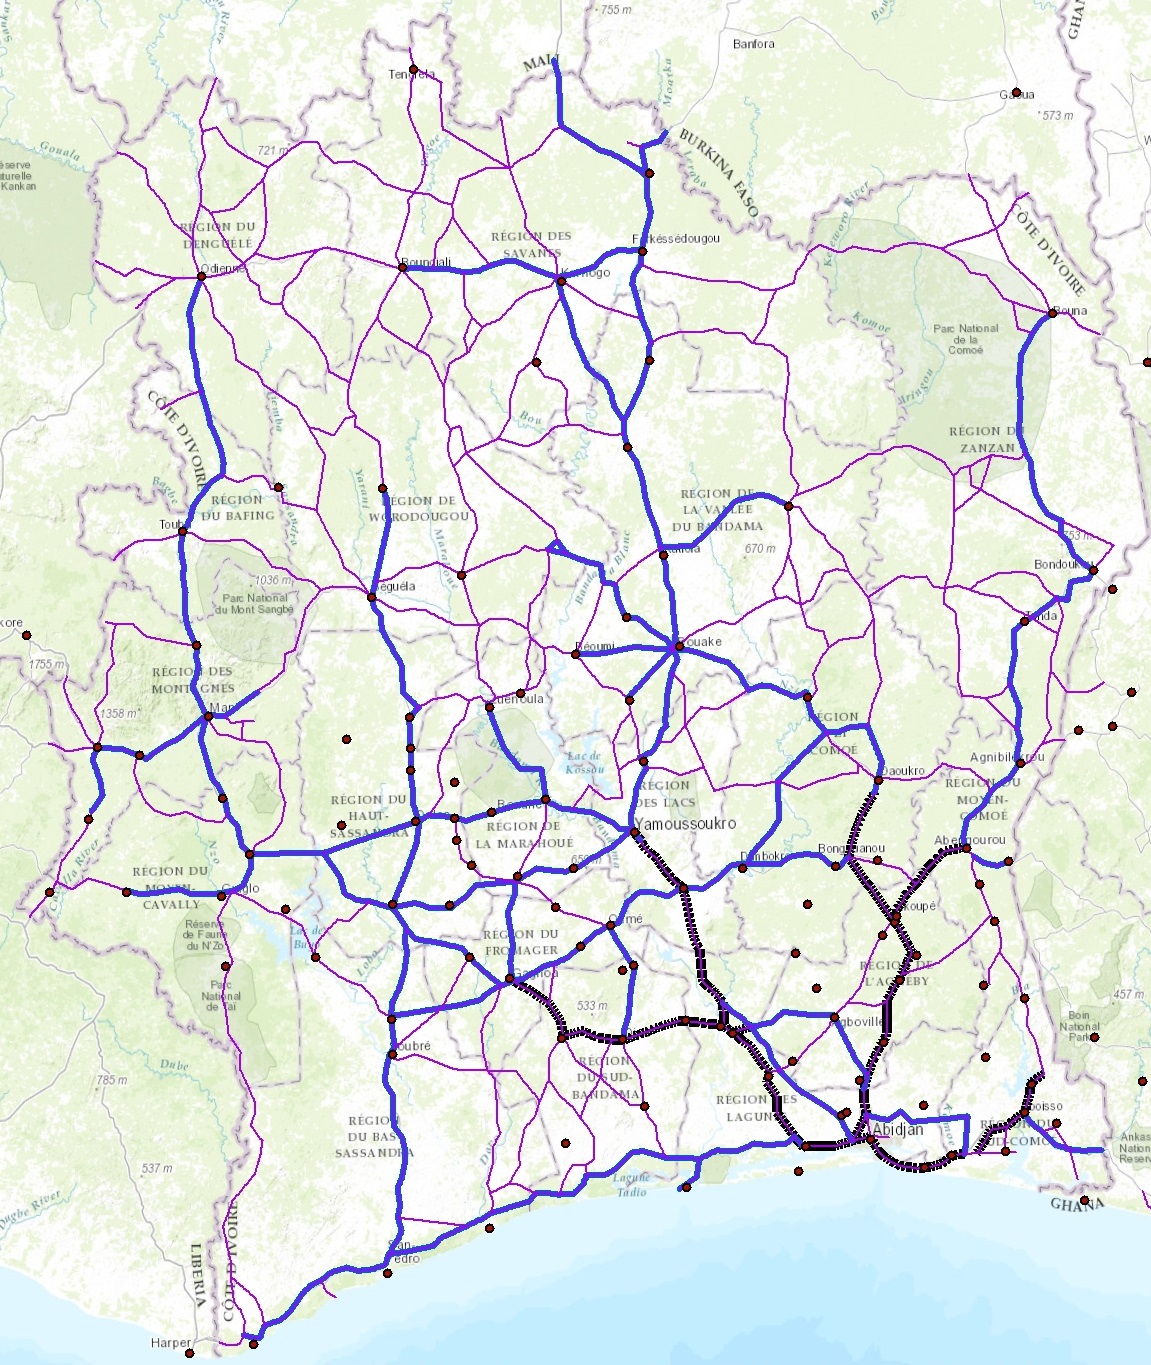
Côte d’Ivoire
Panel A: actual paving between 1965 (black) and 2012 (blue).
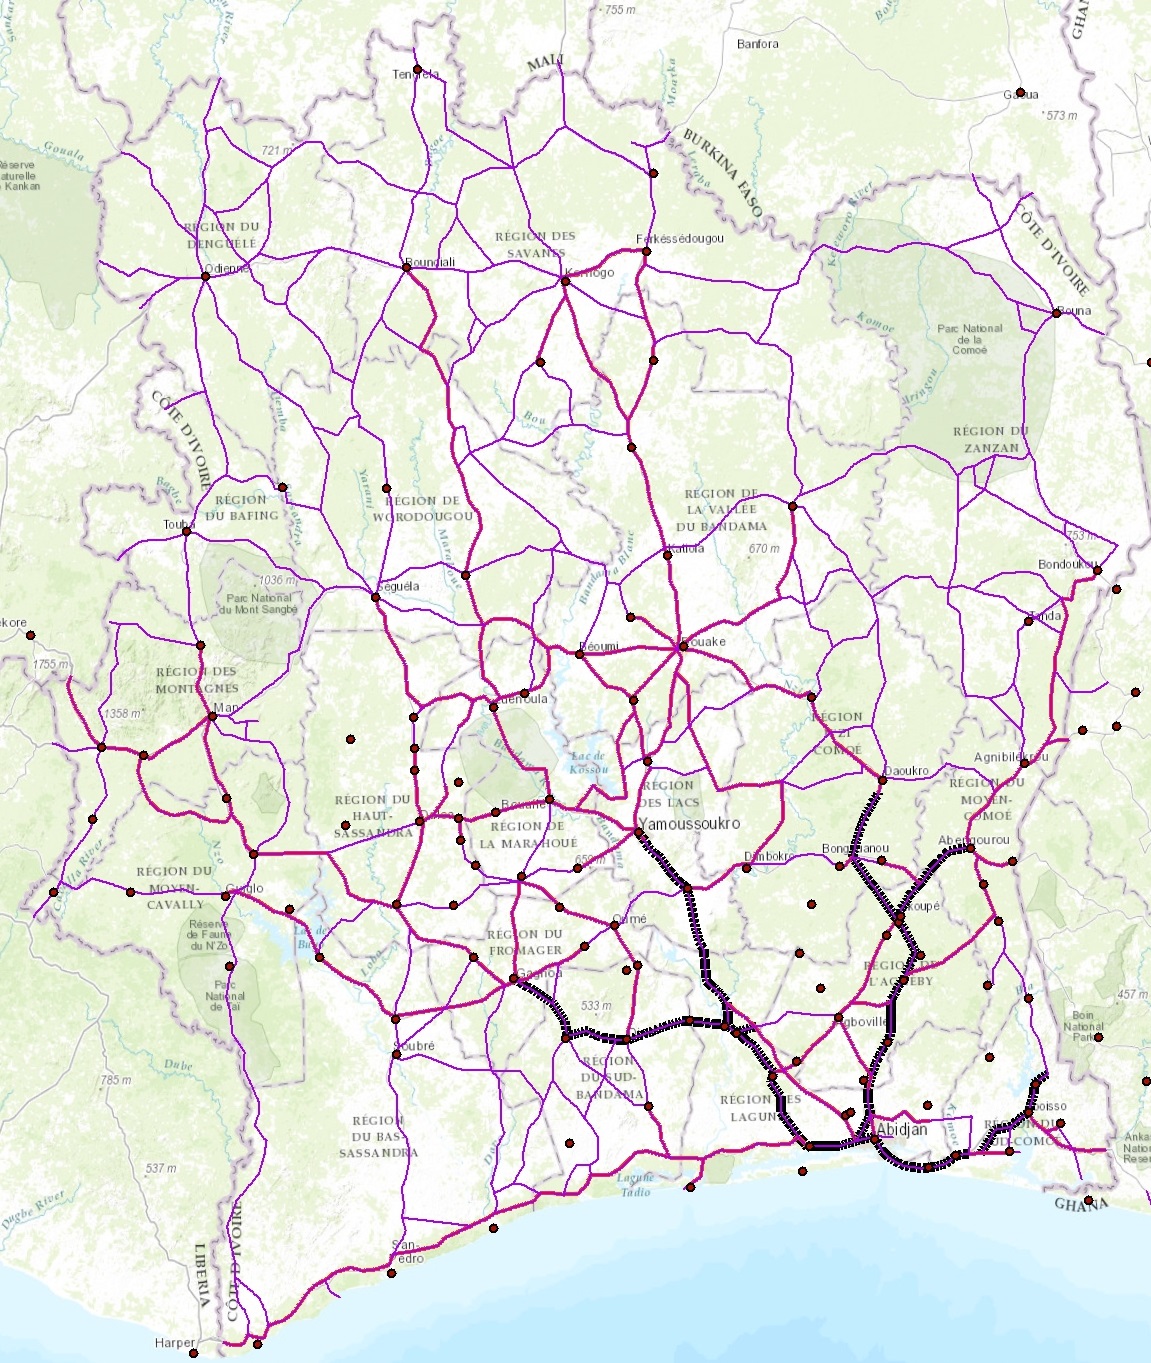
Côte d’Ivoire
Panel B: market potential counterfactual paving between 1965 (black) and 2012 (purple).
Future project goals
Building on this first exploration of the data, we aim to achieve three goals in the rest of this project:
- Detect the extent to which roads built to connect mines to the coast affected the spatial equilibrium of the economy, for example by determining the location and size of cities.
- Quantify, in the context of a quantitative model of infrastructure and trade, the welfare effect of road paving in this period, while comparing it to the optimal counterfactual.
- Investigate the determinants of any discrepancy between actual expansion and optimal counterfactual. Did different types of government prioritise internal connectivity versus resource exploitation? Did this depend on the amount of foreign direct investments or foreign aid that these countries received?
[1] For example, harbours need to be at least 5 meters deep to receive dry bulk ships, which excludes many smaller fishing harbours.