Data-driven healthcare electrification: Measuring power quality for better health outcomes in Sierra Leone
Widespread electrification efforts in sub-Saharan healthcare conceal varying power quality. An IGC study's real-time data collection reveals significant disparities and hidden issues in electricity reliability, underscoring the urgency of continuous monitoring for enhancing interventions and ensuring effective healthcare delivery in low- and middle-income countries.
Hospital power outages can have dire consequences, derailing crucial procedures and even claiming lives. Reports from northern Ghana of newborns lost due to power-related complications speak to the critical role that access to high-quality electricity plays in the delivery of healthcare services.
Over the last decade, sub-Saharan Africa has seen a rise in national and multinational healthcare electrification initiatives. Despite the push towards sustainable development, policy development often lacks the necessary technology and methods to fully grasp the nexus of electricity quality and healthcare quality. However, improved access to high-resolution, continuous, and verifiable power quality and reliability data (PQR) from health facilities, enables decision-makers to formulate more effective healthcare electrification strategies, enhancing both healthcare delivery and outcomes.
Barriers to real-time PQR monitoring in low-resource settings
Important PQR questions like daily usable electricity access in hospitals, often remain unanswered in resource-constrained countries. This is largely because this data has historically been too expensive or technically challenging to collect. Instead, stakeholders rely on more readily available data to set key performance indicators (KPIs) measuring electricity access. In a data starved environment this has the effect of artificially prioritising macro, easy to measure—but somewhat orthogonal—KPIs such as the number of health facilities given electricity connections.
“The traditional binary approach [of measuring energy access] fails to take into consideration the quality, reliability, affordability, formality, safety, and availability of the electricity source.” - Measuring Energy Access
For healthcare electrification programmes that include elements of PQR in their KPIs, programme designers and evaluators often rely on recall-based surveys with health facility staff to understand PQR. This data collection method is complicated by health facilities using multiple energy sources, fluctuating power reliability, and staff’s indirect diagnosis of issues like voltage irregularities or equipment function.
Beyond the health sector, there has been a shift in discourse towards the use of more multidimensional electricity access measurement metrics (for example, the Multi-Tier Framework for Energy Access (MFT). However, the redefinition of energy access measurement has largely been limited to the integration of nuanced electricity access-related questions in survey instruments. The World Bank and World Health Organization (WHO) recently developed a set of PQR-related survey questions (below) and recommended indicators for tracking progress towards SDG-7’s electricity access goals.

Notes: The World Bank and WHO developed and extensively piloted a set of survey questions designed to capture electricity availability, quality, and reliability at households. Surveyed individuals are expected to recall the cumulative hours and number of power outages experienced in the last week, which poses numerous challenges for data accuracy.
The PQR measurement strategy proposed above only represents a snapshot of PQR in time and is not capable of capturing the evolving, dynamic nature of an energy system. This highlights a clear need to improve the assessments of PQR. The methodologies used for computing electricity access and progress towards SDG-7 have not evolved alongside the innovative data collection technologies that are becoming more available.
The importance of access to reliable, high-quality power for health facilities
In critical settings like healthcare facilities, prolonged voltage sags can render essential medical equipment – such as x-ray machines – unusable and power outages can be the difference between life and death for a patient on an oxygen concentrator. It is therefore especially vital to ensure that programmes are designed to monitor progress in improving PQR accurately and continuously.
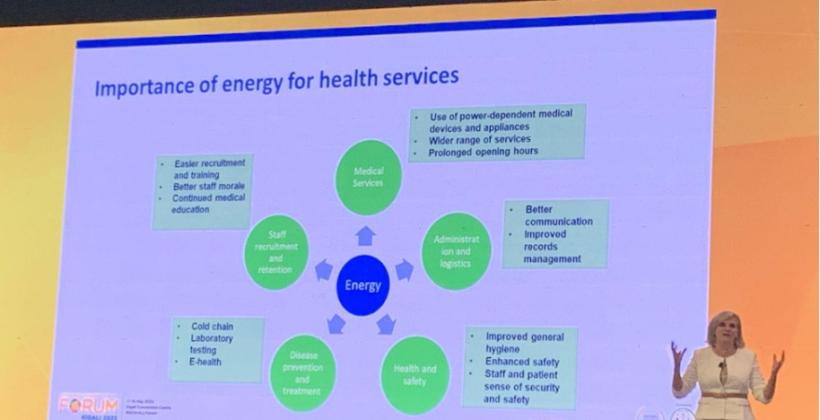
Notes: Dr Maria P. Neira (Director of the Department of Environment, Climate Change and Health at the WHO) presenting at the Sustainable Energy for All (SEforALL) Forum session “Powering Healthcare During and Beyond a Pandemic”.
The COVID-19 pandemic urgently exposed and demonstrated the need for energy resilience to respond to health emergencies. Since then, national and multinational healthcare electrification initiatives have emerged such as the launch of the Power Africa-funded Health Electrification and Telecommunications Alliance (HETA). At the 2022 Sustainable Energy for All (SEforALL) Forum, the WHO led a presentation (above) highlighting the importance of energy for health services; electricity is critical for the provision of medical services, safe operation of a health facility after sunset, effective disease prevention and treatment, and staff recruitment and retention.
Monitoring power in 15 Sierra Leonean health facilities
In Sierra Leone where 38% of health facilities lack access to electricity, under-developed electricity infrastructure contributes to the country suffering one of the world’s highest maternal mortality rates. SEforALL’s Market Assessment and Roadmap for Health Facilities in Sierra Leone, highlighted the “need for investment in reliable data [for the health sector] to capture electrification rates.” We carried out a study to address current PQR data gaps at the health facilities-level in Sierra Leone by showing the feasibility of a novel high-resolution PQR data collection methodology.
We deployed GridWatch, nLine’s remote-monitoring technology, at 15 electrified (on- and off-grid) public health facilities in urban and rural communities. Sensors were plugged into wall outlets at health facilities to collect real-time PQR measurements including power outages (frequency and duration), voltage, and frequency levels. Using machine-learning models grounded in power systems and statistics, sensor-collected measurements were transformed to generate localised PQR profiles and provide a first draft of high-resolution, high-impact, KPIs for monitored health facilities.
Figure 1: KPIs for monitoring power quality in health facilities
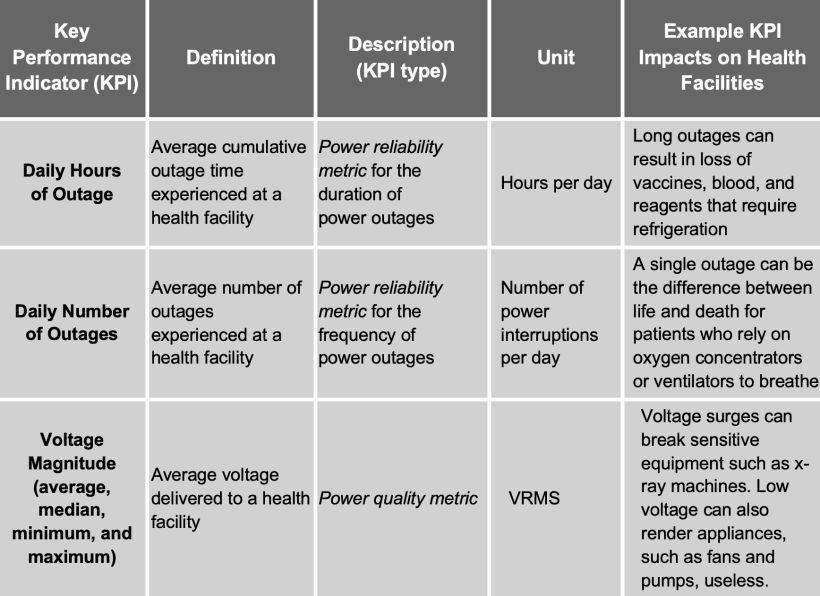
Notes: A table of PQR KPIs produced from sensor measurements. These measurements are aggregated into PQR KPIs.
The 15 health facilities in the sample included seven hospitals, seven community health centres, and one community health post. For this project, data was collected over an eight-week period from June 10 through August 31, 2023. (At the time of publication of this blog post, sensors remained plugged in at all 15 health facilities and continue to measure PQR.)
Initial data insights
“Electrified” is not a binary state
Electrification is not a binary metric, as illustrated by the wide variation in PQR experienced by the 15 electrified health facilities over an eight-week period (Figure 2 and 3). The quality of power can vary widely, from reliable, high-quality electricity (for example, averaging less than one power outage per day and voltage levels within nominal range) to significantly worse conditions (such as a daily average of three outages and 18 hours without electricity). This variation in power quality at already electrified health facilities demonstrate the importance of monitoring electricity quality after the initial connection.
Figure 2: Average daily frequency of power outages (July 20 – August 31, 2023)

Notes: This box plot illustrates the average daily frequency of power outages at the 15 health facilities. Each box shows the middle 50% of data for outages, with the median indicated by the line inside. The "whiskers" show the typical range, excluding outliers. The plot reveals significant differences in power stability across facilities: some, like "Hill Station," have fewer outages, suggesting reliable power, while others, such as "Wellington," experience more frequent disruptions, indicating less reliable power supply.
Figure 3: Average daily duration of outages (July 20 – August 31, 2023)
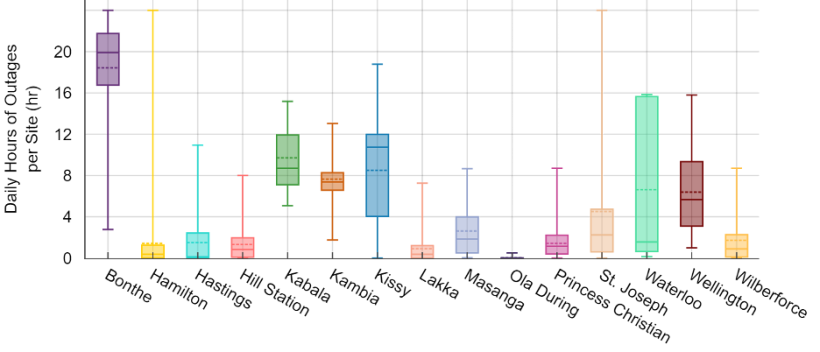
Notes: This box plot displays the average daily duration of outages at the 15 health facilities, highlighting the variability in electrical stability each one faces. Facilities with shorter boxes and lower medians, such as "Hill Station," tend to have more stable power supplies, whereas those with taller boxes and higher medians, for example, "Wellington," experience more frequent power disruptions.
Seasonal variations in power quality and reliability
PQR can vary daily, weekly, monthly, and seasonally, especially when the power comes from a variable renewable energy source like hydropower – which is significant in Sierra Leone, with most installed capacity coming from the Bumbuna hydropower plant whose supply is affected by seasonal rainfall. Sensor data from Princess Christian Maternity Hospital (PCMH), a grid-connected facility and the country’s primary maternity service provider, illustrates this variation vividly (Figure 4). Data shows the stark shifts in both the frequency and duration of power outages at the hospital as time shifted from the end of the dry season (late May) to the start of the rainy season (early June). This case emphasises the importance of continuous monitoring to understand the full PQR experience of an electrified facility throughout annual seasons.
Figure 4: Seasonal influence on power outages at PCMH over 19-weeks
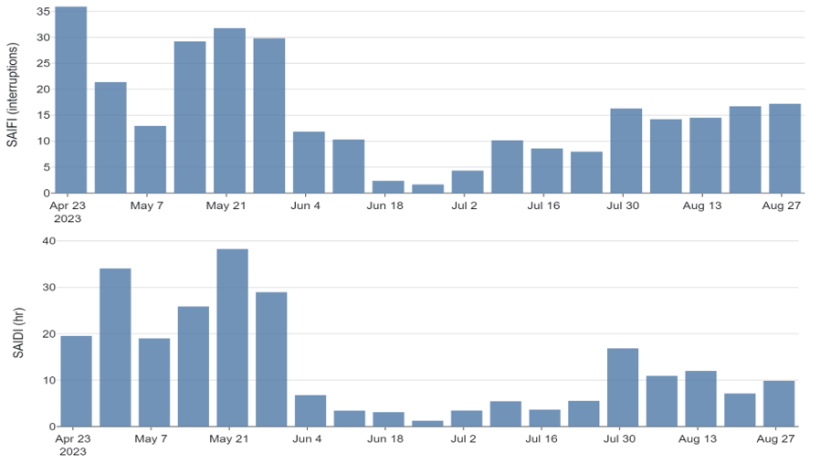
Notes: The twin bar charts present a 19-week time series analysis of PQR at Princess Christian Maternity Hospital. The top chart tracks the weekly frequency of power outages, while the bottom chart shows the average duration of these outages each week. There is a noticeable decline in both the frequency and the average duration of power outages beginning in early June, which aligns with the start of the rainy season.
Power quality and reliability vary across subregions in Freetown’s bulk grid network
Both power quality and reliability are best for grid-connected health facilities in Freetown’s west region, slightly worse in Freetown’s central region, and meaningfully worse in Freetown’s east region (Figure 5). Since PQR for grid-connected health facilities in Freetown varies by geographic region within the bulk-grid network, it is clear that a base level of service – in terms of supplying power within nominal voltage range and of reasonable reliability – is not provided equally for all utility-paying health facilities. For facilities that rely strictly on the grid as their sole power source, this can have meaningful impacts on the delivery of healthcare services.
Figure 5: Comparing PQR in East and West Freetown
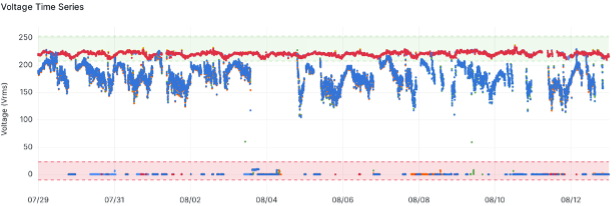
Notes: This time series view of raw sensor voltage levels illustrates the difference in PQR experienced by a grid-reliant health facility located on the west side of Freetown (red) and a grid-reliant facility located on the east side of Freetown (blue). In the eastern region, voltage levels are consistently below nominal voltage levels and power outages occur daily, often for 4-6 hours. Power outages can be seen in the visualisation via the gaps in voltage data and corresponding 0V levels.
Investing in data to understand the state of healthcare electrification
This project demonstrates that remote, real-time, longitudinal collection of PQR measurements can serve as a foundational tool in designing, evaluating, and understanding healthcare electrification programmes by independently auditing electrification at health facilities. Further, by measuring multifaceted attributes of energy access at health facilities, we demonstrate that formerly insurmountable PQR data gaps can be bridged quickly and efficiently.
“Innovative technologies such as remote monitoring can generate valuable data that can help validate (energy system) performance and (provided energy) services…[Use] digital remote monitoring to calculate and monitor KPIs, and to offer public and private actors real-time information about the state of health centre electrification.” - From Procurement to Performance: Towards a private sector-led, service-based model to scale up sustainable electrification of public institutions
Finally, the more alarming trends within our sample—daily outages at every health facility in the study, sustained damaging undervoltage for many facilities—punctuate the importance of further innovation in both PQR measurement techniques and regulatory standards for the health sector in low- and middle-income countries. This work, while describing a relatively small sample, represents a proof of concept that could usher in a more sustainable future for many types of electrification projects.
To learn more about how remote monitoring can overcome challenges in PQR data collection and help establish PQR standards for healthcare electrification, read the full project report and policy brief.

