The demand for air quality information and forecast training in urban Pakistan
A study conducted in Lahore, Pakistan, sheds light on the impact of air pollution information and human capital enhancement on urban residents’ behaviour and decision-making. This research underscores the potential of enhanced air quality forecasting to empower residents, enabling them to avoid pollution and adjust their activities according to air pollution levels, thereby leading to substantial welfare improvements.
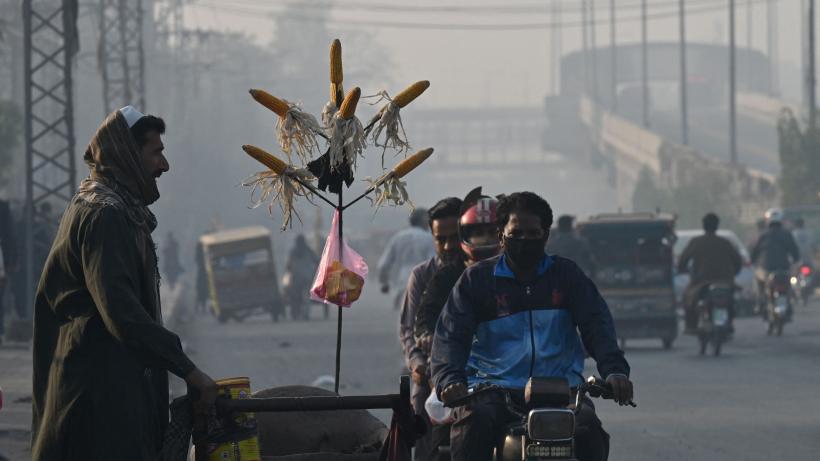
South Asia perennially experiences the worst air quality in the world, posing a significant risk to human health. In Lahore – Pakistan’s second most populous city and the capital of Punjab province – reducing particulate matter (PM2.5) levels to the World Health Organization’s (WHO’s) standards would lead an average resident to gain 7.5 life years. Beyond mortality and morbidity, both long-term and short-term exposure to hazardous air impairs brain development and cognitive ability, affecting school outcomes, labour productivity, and decision-making in general.
Figure 1 depicts Lahore’s daily PM2.5 levels in micrograms per cubic metre (μg/m3) from February – August 2023. Data from three different sources is presented alongside the local Environmental Protection Department’s (EPD’s) daily PM2.5 mandated standard and the WHO’s daily PM2.5 recommended safe standard. The trends reveal that Lahore’s air pollution levels exceeded both the mandated and recommended safe standards for nearly the entire six-month period and on an overwhelming majority of days, pollution levels remained considerably higher than the established standards.
Improving air quality in cities like Lahore presents a significant challenge. Although the broader policy response is clear, a lack of resolve among policymakers means citizens can’t afford to wait for official action . Facing persistent hazardous air quality, citizens must adapt to independently to safeguard themselves from air pollution’s myriad harmful effects.
Figure 1: Daily PM2.5 air quality measurements in Lahore from multiple sources (February – August 2023)
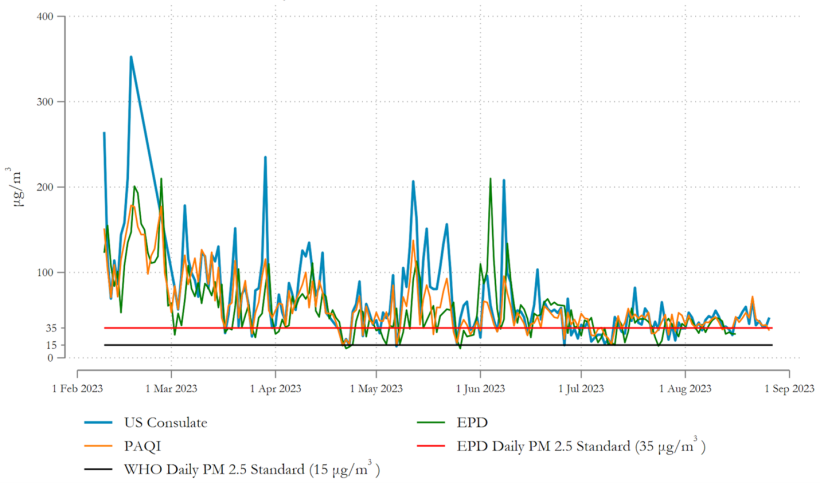
Notes: This figure shows Lahore’s daily PM2.5 levels (in μg/m3) from Feb – Aug 2023 by three different sources—1) United States Consulate, Lahore (US Consulate [blue trend line]); 2) Pakistan Air Quality Initiative (PAQI [orange trend line]); and 3) Environment Protection Department Punjab (EPD [green trend line]). The red horizontal line represents the EPD’s daily PM2.5 mandated standard while the black horizontal line represents the World Health Organization’s (WHO’s) daily PM2.5 recommended safe standard.
Air pollution forecasts
Air pollution forecasts enable citizens to avoid hazardous air and adapt to air pollution. Economic theory predicts that forecasts generally improve welfare. For example, accurately forecasting rain tomorrow, might lead one to carry an umbrella and avoid getting drenched. Likewise, anticipating an income shock next month could prompt one to adjust current consumption to buffer the predicted shock. Similarly, if citizens can forecast high pollution, they may act accordingly to avoid poor air quality.
Residents of cities in developing countries encounter difficulties in accurately forecasting air pollution due to a complex information landscape. While some public and private sources in Lahore, offer retrospective and real-time air quality information, these efforts are sporadic and lack consistency in both spatial and temporal coverage with questionable information quality. Accessibility to these readings, particularly for the non-English speaking majority, is limited. Air pollution forecasts, on the other hand are entirely absent.
Human capital levels (such as education, training, skills) also hamper residents’ forecasting ability.. For example, an average Lahori receives less than seven years of education while an average Pakistani receives under five years. This is a year lower than India, and roughly comparable to Uganda, Ethiopia, and Nigeria. Residents across developing countries face similar skill constraints and may confront the same behavioural biases that generate forecasting errors even in highly educated populations.
Understanding the demand and impact of air quality information
We study how urban residents in developing countries solve air pollution forecasting problems in the presence of limited information and human capital. We concern ourselves with the following broad questions: 1) do city residents value air pollution forecasts? 2) can we improve their forecasting ability? 3) how do forecasts influence their behaviour, especially air pollution avoidance? The answers to these questions shed light on human decision-making and inform benefit-cost analyses of policies concerning air pollution monitoring and abatement.
To address our research questions, we implemented a randomised controlled trial with roughly 1,000 residents of a lower-middle-income neighbourhood in Lahore, Pakistan. Our experiment included two treatments: 1) day-ahead air pollution forecasts delivered by text message (SMS) for eight months; and 2) general in-person training designed to improve forecasting performance. Before treatment deployment, during our baseline survey, every respondent received a pamphlet explaining (in basic Urdu) what fine particulate matter (PM2.5) is, how it is measured, and its health effects.
We designed a model to forecast day-ahead PM2.5 air pollution, combining data from the Lahore US Consulate’s pollution monitor and two satellite sources (MeteoBlue and SPRINTARS). We delivered the PM2.5 forecasts through SMS at 8 p.m. every evening for eight months to a random subset of our respondents.
We also implemented a one-hour training in forecasting skills based on the principles of Philip Tetlock and Daniel Kahneman with another random subset of our respondents. The training broadly aimed to reduce behavioural and psychological mistakes that decrease the accuracy of subjects’ forecasts.
Some of our respondents received both the forecasts and the training. Respondents in the control group received neither treatment. We compare the average outcomes of respondents in our treatment groups with those in the control group. Figure 2 depicts the experimental groups.
Figure 2: Allocation of sample households to control and treatment groups
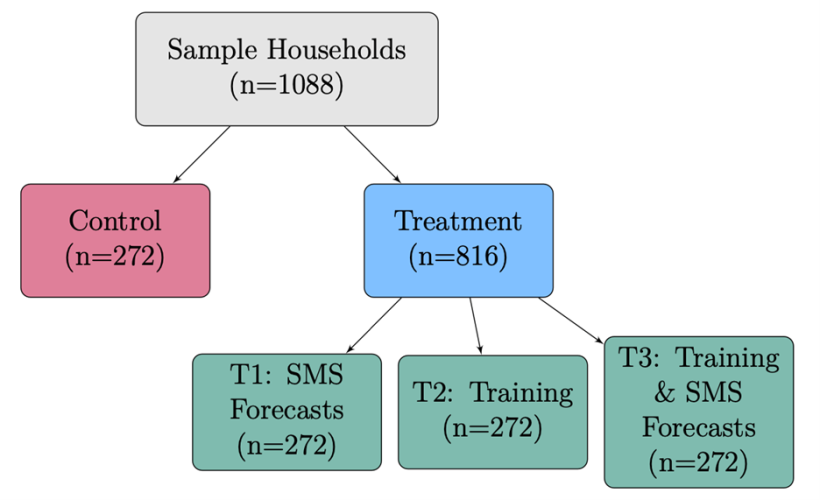
Notes: This figure illustrates the distribution of 1,088 sample households into control and treatment groups for the study. The control group comprises 272 households that did not receive any intervention. The treatment group is further divided into three subgroups, each consisting of 272 households. The first treatment group (T1) received SMS forecasts, the second (T2) received training, and the third (T3) received a combination of training and SMS forecasts. This division allows for an analysis of the individual and combined effects of SMS forecasts and training on the households' outcomes.
The study focused on the following outcomes: 1) willingness to pay for air pollution forecasts; 2) error in forecasting air pollution; 3) willingness to pay for particulate filtering (N95) masks; and 4) time use (time spent outdoors) in response to air quality. To elicit truthful responses, we incentivised the first three outcomes. The experiment ran over April 2019 – February 2020, concluding just before the COVID-19 pandemic broke out in Pakistan.
Residents place high value on air pollution information
Respondents who received our one-day-ahead air pollution forecasts showed a willingness to pay an average of 93 PKR (as valued in January 2020) to continue receiving forecasts for 90 days (Figure 3). On a monthly basis, this equates to roughly 60% of the cost of 4G mobile internet access or 20% of a day's earnings for an unskilled labourer. Thus, scaling this service city-wide, in a city with close to 14 million residents would yield substantial public benefits relative to the costs of service provision.
Figure 3: Willingness to pay (WTP) for air pollution forecasts
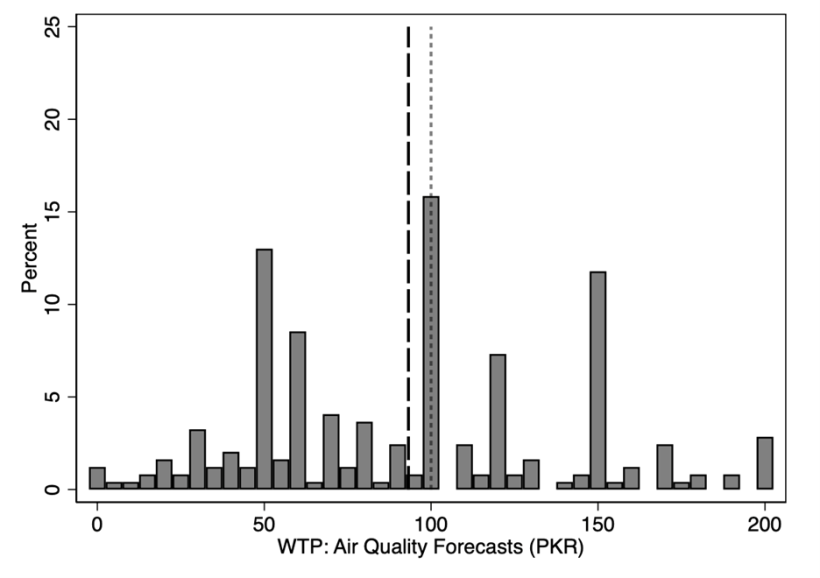
Note: This figure shows the willingness to pay (WTP) in Pakistani Rupees (PKR) to continue receiving air pollution forecasts for another 90 days for respondents who received our daily day-ahead forecasts. The vertical long-dashed line marks the average WTP at 93.22 PKR, while the vertical short-dashed line marks the median WTP at 100 PKR. We elicited the WTP using an incentivised mechanism (Becker-DeGroot-Marschak) with a maximum bid of 200 PKR.t
Possible to improve residents’ pollution forecasting ability
Both forecast provision and in-person training improved respondents’ pollution forecasts. Both treatments reduced respondents’ error in forecasting fine particulates (PM2.5) by roughly 5 μg/m3, equating to approximately 20% of the World Health Organization’s recommended maximum safe 24-hour standard. Considering that our outcomes were elicited four to six months after training the respondents, the notable error reduction demonstrates the lasting impact of our training in building durable human capital.
Improved air quality forecasting empowers residents to avoid pollution
Forecast provision increased willingness to pay for particulate filtering (N95) masks by roughly 5% of the retail price (Figure 4). While forecast training also increased the willingness to pay for particulate filtering masks by a similar amount, our estimated effect is statistically imprecise. Pooling all respondents, the average willingness to pay for N95 masks was roughly 70% of the retail price.
Figure 4: Demand curves for particulate filtering (N95) masks
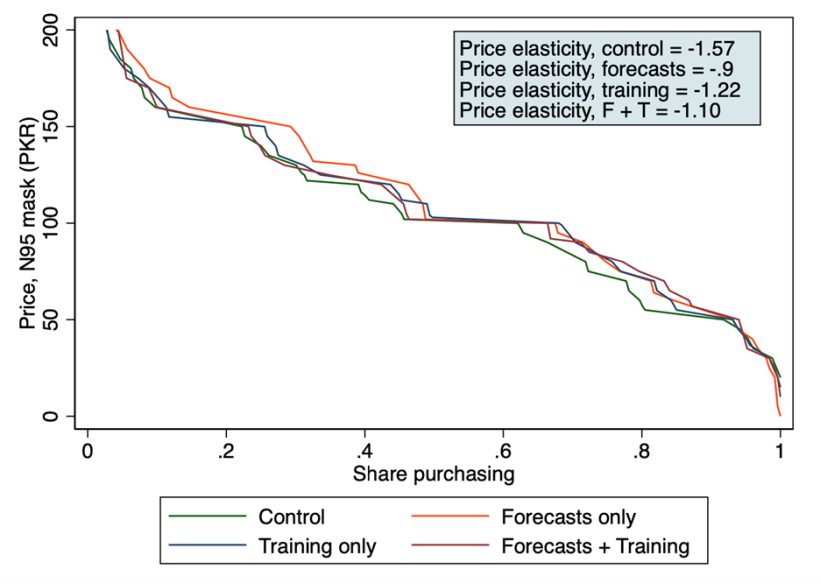
Note: This figure shows the demand for particulate filtering (N95) masks across the control and treatment arms. We elicited willingness to pay (WTP) using an incentivised mechanism (Becker-DeGroot-Marschak), in which all subjects bid on an N95 mask with a retail price of 135 PKR. We capped the maximum bid at 200 PKR. We’ve expressed quantity demanded as the share of subjects purchasing—that is, the share with WTP greater than or equal to a given price.
Residents aligned their activities according to air pollution levels
We found that respondents who received our pollution forecasts spent 16% more time outdoor on relatively less polluted days and reduced outdoor time by 3% on more polluted days. These results were more pronounced for individuals who reported caring about air quality (during our pre-treatment baseline survey) and for children.
Policy takeaways
We present evidence of meaningful willingness to pay for air pollution forecasts among developing country urbanites. This suggests that the scarcity of environmental information in many developing countries does not stem from a lack of demand. While capital and operating costs for reference-quality air pollution monitors are considerable – often exceeding US$ 20,000 – the level of demand we estimate indicates that investing in pollution monitoring and forecasting in cities such as Lahore will lead to considerable welfare gain.
We show that providing increased air pollution information and enhancing human-capital enables urban residents to forecast more accurately. Most strikingly, our one-hour forecast training reduced forecast error for incentivised predictions even six months later. Such exercises complement education and job trainings. Policymakers could scale these debiasing lessons and exercises in our trainings through low-cost channels such as videos and videogames.
We also demonstrate that exposing residents to air pollution information significantly boosts their willingness to pay for protective (N95) masks. This indicates that in areas where mask-wearing is uncommon, disseminating information could encourage the adoption of N95 masks and other pollution avoidance measures. Our finding that the average willingness to pay for masks is roughly 70% of the retail price, suggests that even modest subsidies could lead to a substantial increase in mask uptake, with concomitant health benefits.
